
I recently made an impromptu tool in Excel to answer a question I was asked in Quora. It’s a small, nimble tool that calculates returns from an India Equity SIP based on historical averages and standard deviations.
I filtered for all Mutual Fund schemes except Sectoral and/or closed ones. The end results was the data pertaining to 462 different Mutual Fund schemes, for 6 different investment periods: a total of 2,772 individual data points.
Here is the tool (Downloads can be made from File → Download As):
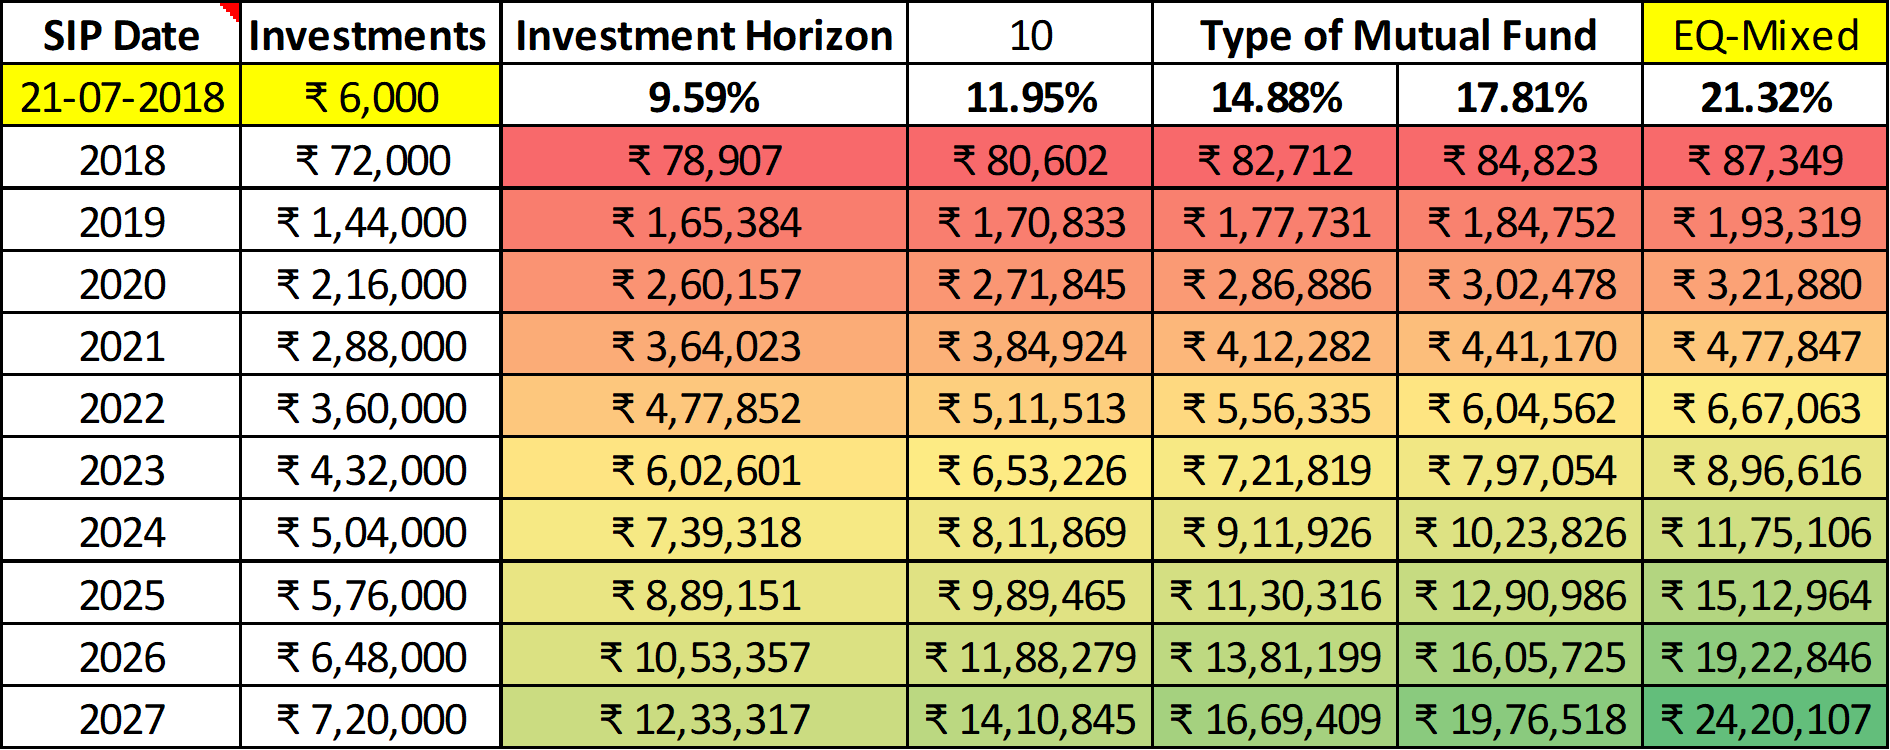
This is how it looks like:
Notes:
- The values in the middle column (In the screenshot, the 14.88% column) are the most probable.
- You can modify the cells highlighted in yellow only. Changing anything else will mess up the model.
- The investments are per month (So, in the screenshot, it is Rs. 6000 per month)
- In order to expand the investment horizon, read the comment on cell A1.
- As credited in the answer itself, the data is taken from https://www.valueresearchonline.com. I do not own any of the data.
- There are two hidden sheets: one with the data from VRO and one with a charts of returns/deviation which gets automatically updated based on the changes you make to the ‘Type of Mutual Fund’. You can unhide them if you like. But it’s better to keep them hidden, lest you make changes to them by mistake.
- I will try my best to update the historical data from VRO (Or other sources) at least on an yearly basis, so the model stays relevant.
I understand that there are a gazillion tools available online, which calculate returns on an SIP based on a required rate of return. But none of them calculate it based on historical averages, so I thought I’d make one. Happy investing!