
If you remember my post few months back, I was predicting a fall in Page industries stock around 14200 and to my luck the stock moved accordingly. May be this is called beginner’s luck. Ok, let me try my hand at Cupid’s chart?
Link to my Page post:
Cupid Chart:
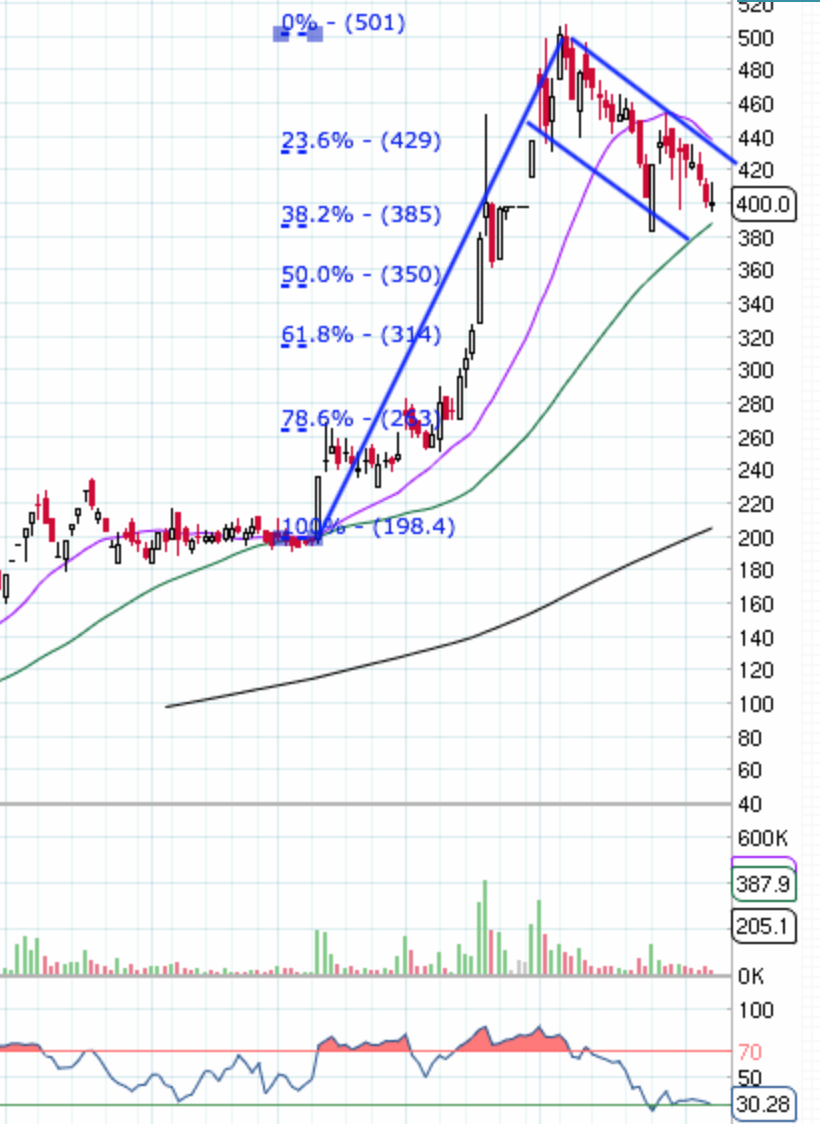
- For my eye, it looks like Cupid has formed a ‘flag’ and ‘pole’ with targets of length of the pole IF the price breaks out above the ‘top flag line’?
- The volumes are also supportive, meaning the volumes are high during the pole formation and they are low during the ‘flag’ formation.
- This is indicative of bullish ‘flag-pole’ pattern which is typically formed after a steep move.
- Fibonacci retracement tells that it fell and took support around 38.2% retracement levels which is good.
- Do you think I’m blind because of my holding bias and the above deductions from the chart are just my ‘blah blah…’ or weekend timepass?
- During the past week’s correction, Cupid showed ‘relative’ strength though whenever there were some downward spikes, buying emerged.
- This correction is really healthy after such a big up move, it will only improve technical health of the charts. I would have been wary if it were to be an upward move only. It might be that the stock is forming a base for the next up move.
- During this phase, typically the less conviction ones and with low holding time period or the ones who have found a better opportunity move out of the stock slowly.
Appreciate if any technical experts can provide their perspective.