
Investor presentationadf8a8aa-52a6-4249-919b-a6555e6e3c86.pdf (1.9 MB)
Press release4d18b48e-7a4c-4eb5-857f-87e369e3619c.pdf (1.6 MB)
I actually think the numbers are just fine. Growth as expected was muted more importantly in the presentation that the company has come out it is very clear that there is ample liquidity. One of the key test of Asset Quality is when the loan growth slows down and that is where I think the company has done really well and one can see NPAs falling QoQ.
If one looks at the overall quality of the book unlike some of the competitors the loan book constitutes of 90% housing loans and builder loan is just .06%. What is very clear is despite slowdown canfin has done most things right.
8 Likes
Q2 results has rekindled hopes that bad days are behind us and good days are not too far ahead. Branch expansion is gathering pace so disbursements are likely to pick up over next few quarters. Investors appear to be buying this idea. Canfin homes stock price is showing signs of a recovery and its not just canfin but other HFCs are also showing early signs of a bottom.
Diagram below shows that HFCs are recovering as a group with canfin leading the pack.
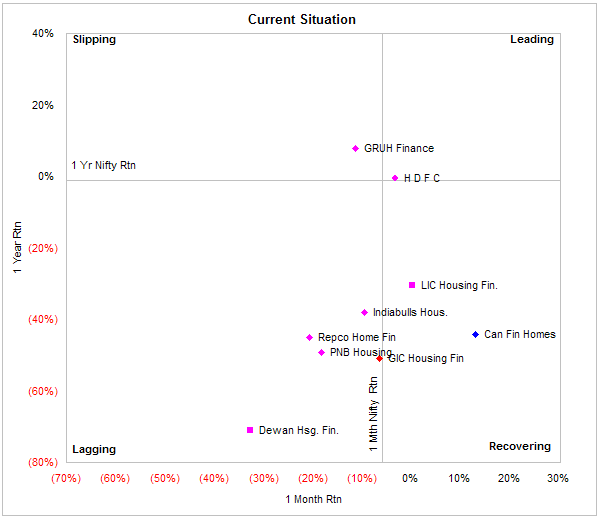
Source: NSE
Leading - Stocks outperforming Nifty in both 1 yr and 1 month periods
Slipping - Stocks outperforming Nifty in 1 yr but under performing in 1 month period
Lagging - Stocks under performing Nifty in both 1 yr and 1 month periods
Recovering - Stocks under performing Nifty in 1 Yr but outperforming in 1 month period.
About a month ago, entire HFC pack (with the exception of Gruh and HDFC) was deeply lagging Nifty
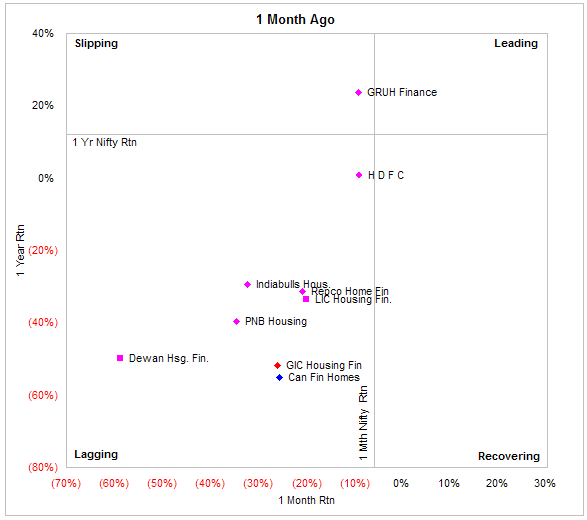
Source: NSE
Investors are now differentiating between HFCs with large exposure to developer loans and those with least exposure to developer loans. Canfin, GIC and LIC have relatively small exposure to developer loans and these could lead the recovery.
Its not necessary that individual stocks will follow the cycle (Leading → Slipping → lagging → Recovering → Leading) but my experience is that sectors generally follow this pattern as investors rotate in and out of sectors. HFC appear to be following this pattern. About a year ago many HFCs were in the ‘slipping’ quadrant and two years ago many were in ‘leading’ quadrant and now appear to be moving into recovery quadrant.
13 Likes
Isn’t that Canfin ran aggressively during stake sale process / rumors & have been taking deep southern dive since stake sale process was called off. Many big players have also moved out. Now considering major correction (more than 60% - 70%) from top, we see a cat bounce, which is hardly 10%-15% from recent lows. We need to note that it still needs 200% northern trip to reach it life time high.
As it has corrected heavily, I take above graphs / values as minor bounce till it starts showing 8%-10% QoQ price movement for next 3-4 quarters
Some notes/thoughts based on AR18, HY19 results & conf call →
ASSET SIDE
Retail Book
Firstly, Can Fin Homes has remained focused on the retail loans for several years and has very minuscule part in builder loans, mezzanine funding, construction finance etc. (10Cr builder loan exposure on Sept’18). This has served them well in the past in terms of asset quality & hopefully this will continue to do so in future. I derive a lot of comfort from asset side book of CanFin.
Competition for Salaried Loan Book Pie
Next, around 72% of the book is from Salaried class & 28% is from non-salaried class. The average ticket size of CanFin is ~18L. From AR18,
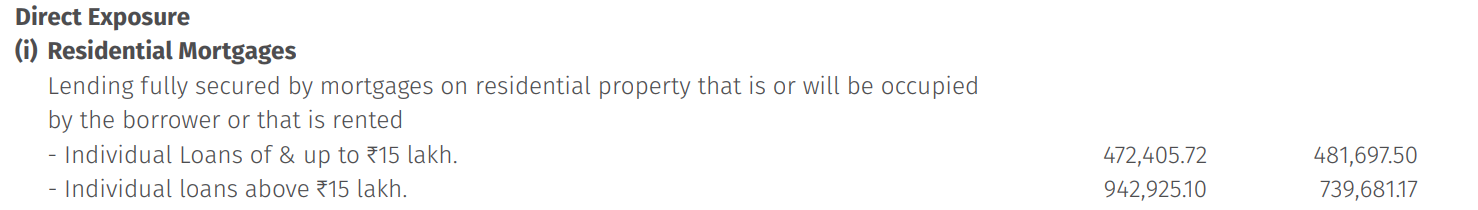
So loans above >15L form a large part of loan book and some of these loans might have ticket sizes of 25-30-40L. So this side of the loan book will always face the competition from the banks as lending to salaried class is probably easiest form of underwriting. Management has conceded this fact in conf call by saying that balance transfer is a menace. (e.g. they did disbursement of 2600Cr & loan book grew by 1200Cr for 6M ending Sept 18 - Loan Book: Mar’18 - 15743, Sept’18 - 16935). The average rundown rate of loan book was 17-18% which has gone up to 23-24% in recent few quarters.
Management expects that - in rising interest rate & liquidity crunch scenario, balance transfer rate will go down & hopefully loan book will grow. To counter the balance transfer issue, management claimed to be expanding in tier 2/3/4 cities & deeper into rural/semi-urban areas. Also management is sharpening focus on EWS & MIG-1 segment by affordable housing loan centers (AHLC).
This also provides us with 2/3 patterns to check for NBFCs -
- To have some competitive advantage over banks in retail lending side, small ticket size is probably beautiful. In my view, the cost for a full-fledged bank to source loans worth size 3-5-10-12L might be very high & the motivation to go after that segment is probably low for banks.
- Lending to non-salaried class with good asset quality is probably a very good competitive advantage. If one can keep the ticket size low in non-salaried class, that is even better!
These are two things that Gruh Finance probably does better than Can Fin Homes & hence the business resilience. I did not understand these things 2/3 years ago in terms of differentiating two businesses from one another.
Some observations from 7 year highlights (page 18/19 in AR18)
Firstly, market loves growth & multiple gets expanded during high growth phase & gets contracted when growth fizzles out. When we are investing in companies which have high multiple, it is important to do a lot of work on growth side of the story.
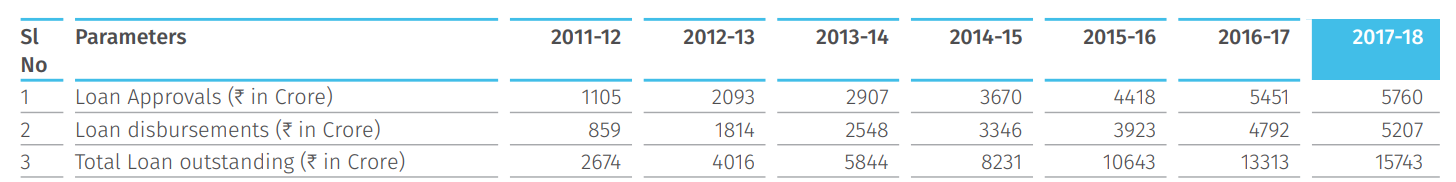

Loan disbursements hardly grew from FY17 to FY18 & so did the number of branches. Hopefully low growth situation shall get rectified with opening of 19 branches & 1 AHLC during Q2FY19. Further if book rundown rate comes down as claimed by management, at least loan book growth shall be visible over next few quarters.
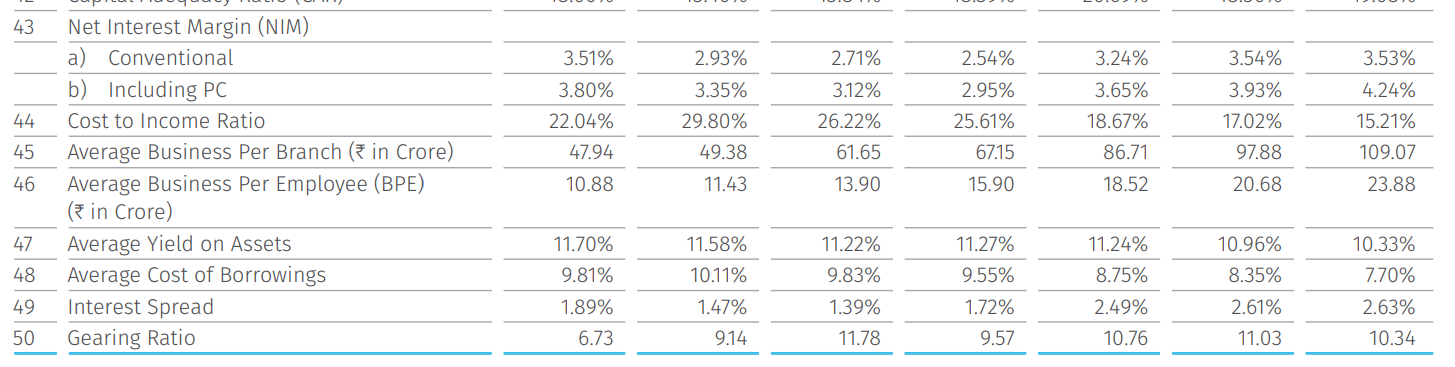
2/3 observations from above snapshot -
- Firstly I think we are at probably lowest cost to income ratio for CanFin as loan book growth was achieved by more than doubling the business per branch(BPB)/business per employee(BPE) in last 7 years (BPB up from 48Cr to 109Cr). BPB seems to have plateaued at 107-109Cr from FY18 to HY19. With opening of new branches & corresponding hiring, cost to income ratio might start inching up.
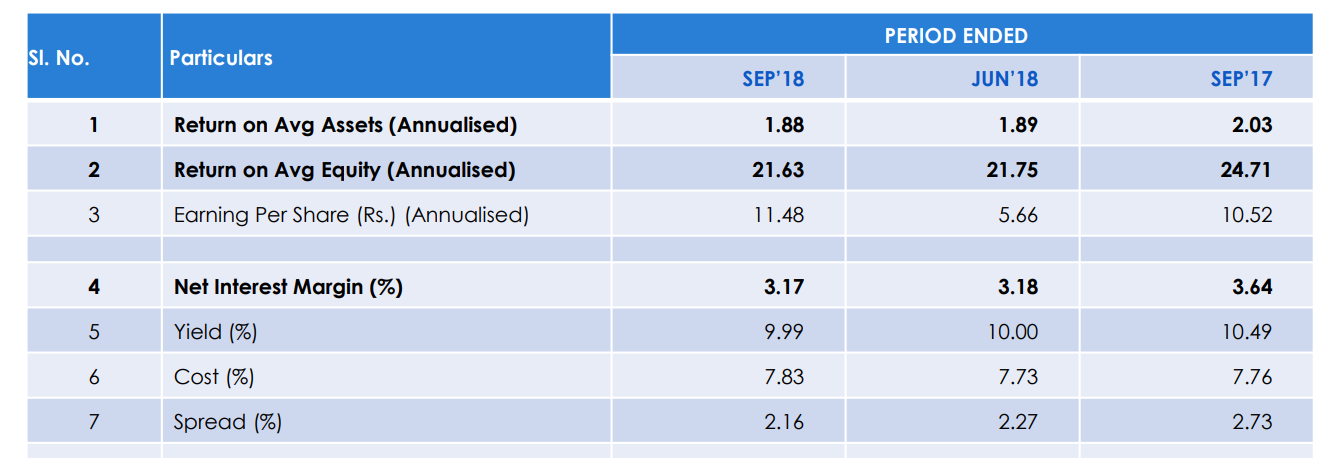
- Secondly, last time cost of borrowing were 9%+ were in the years FY12-FY15. And the interest spread did go down from 1.89% to 1.39% before coming up to 1.72%. I do not have any insight to say that history might not repeat itself & interest spread remains a key moniterable for me.
A small technical detail which I have always wondered was - what leads the NIM > Yield?
it turns out that - it is quite simple actually =>
NIM = (Interest Earned - Interest Expended)/Assets = (Interest Earned/Assets) - (Interest Expended/Assets)
Spread = (Interest Earned/Assets) - (Interest Expended/Liabilities)
NIM > Spread => Interest Earning Assets > Interest Earning Liabilities.
i.e. decent part of assets are funded by non-interest bearing liabilities/equity.
Another thing to notice is that - in low growth scenario (i.e. Growth < RoE), for high RoE finance companies, capital adequacy ratio tends to go up.
Annual Rate Resetting
This feature that CFH introduced is a little bit confusing or misnomer.
For customers who have signed up for this feature, they get fixed interest rate for entire one year.
For customers who have not-signed up for this, their interest rates remain floating & banks can adjust them whenever they find it appropriate.
This feature probably helps (or helped ?) CFH in falling interest scenario (of 1 year liabilities) but this will have lagging effect on repricing in rising interest rate scenario. This also probably can explain fall in yield on advances in short term.
LIABILITIES SIDE
Bankers
It was asked in Q2 FY19 conf call about the number of bankers & their division between private/PSB etc. The management deflected this question by saying that - quantum of funding is more important that number of bankers.
But AR18 does provide the name of the bankers - SBI, Laxmi Vilas Bank, Federal Bank, HDFC Bank & Canara Bank.
Another thing of interest here is relationship between parent Canara Bank & CFH. Page 80 of AR18 provides some details -
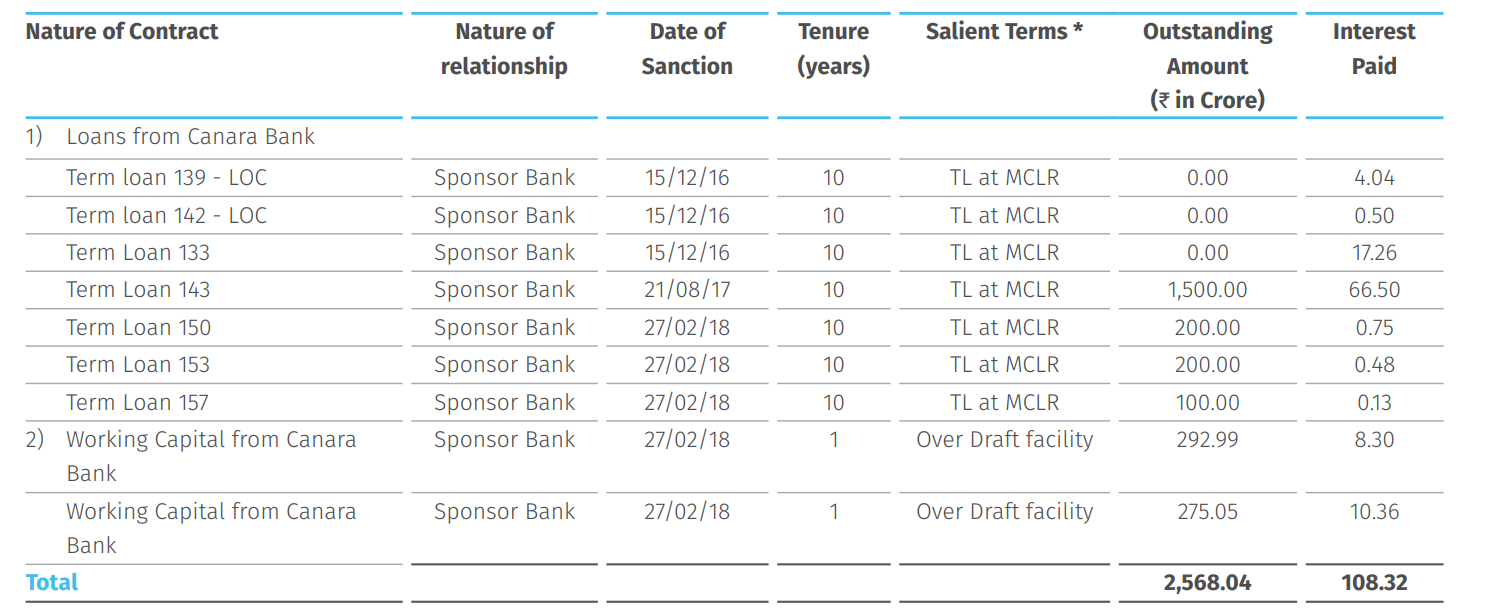
2568Cr worth of funding to CFH is provided by Canara Bank which forms ~22% of their total funding as of FY18. This number might have gone up in FY19.
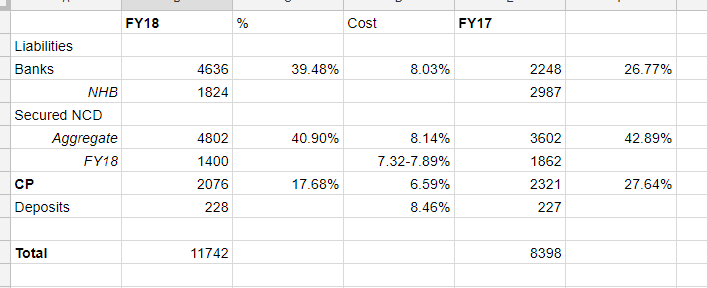
Commercial Papers
As of FY18, 2000Cr+ of liabilities were funded by short term CPs which has average cost of 6.59%. The ratio was even higher in FY17. This was the primary reason for increase in spreads & RoA.
Going by Asset Liability management table for FY18, ~3477Cr worth of NCDs/CPs are going to mature in FY19.
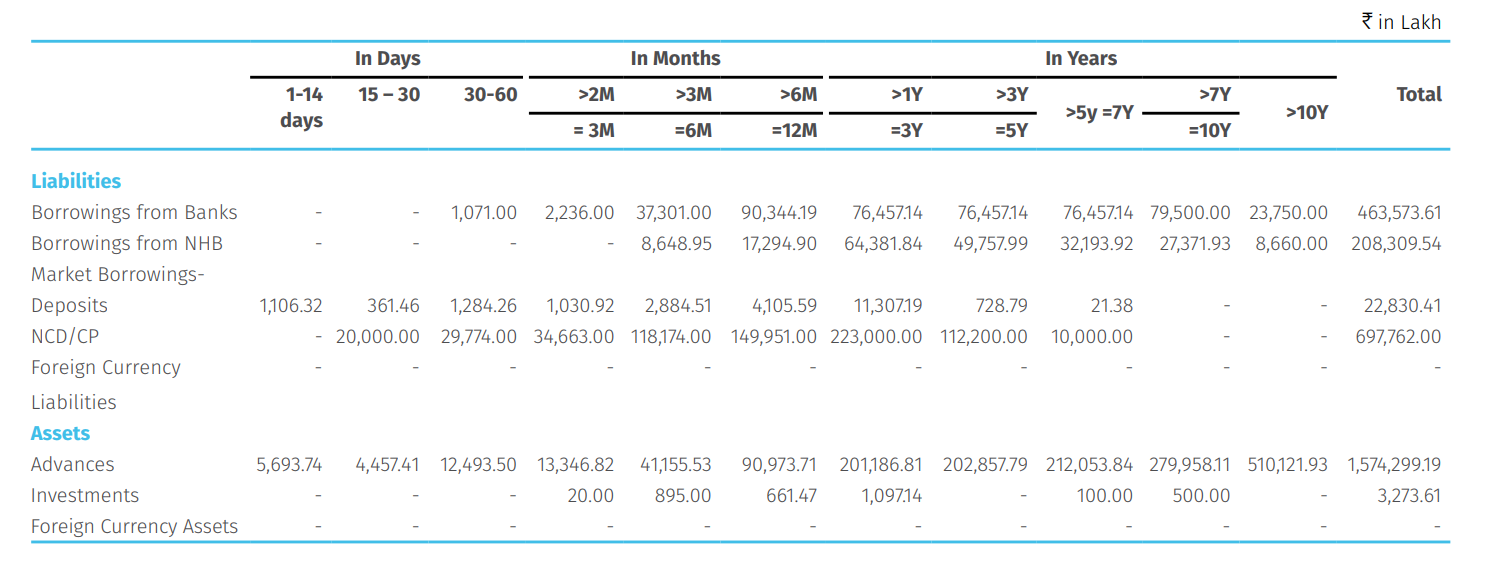
It seems like the CPs worth 2000Cr are being refinanced with bank loans & effect on spread & NIM is already visible in HY19 results.
HY19 funding details →
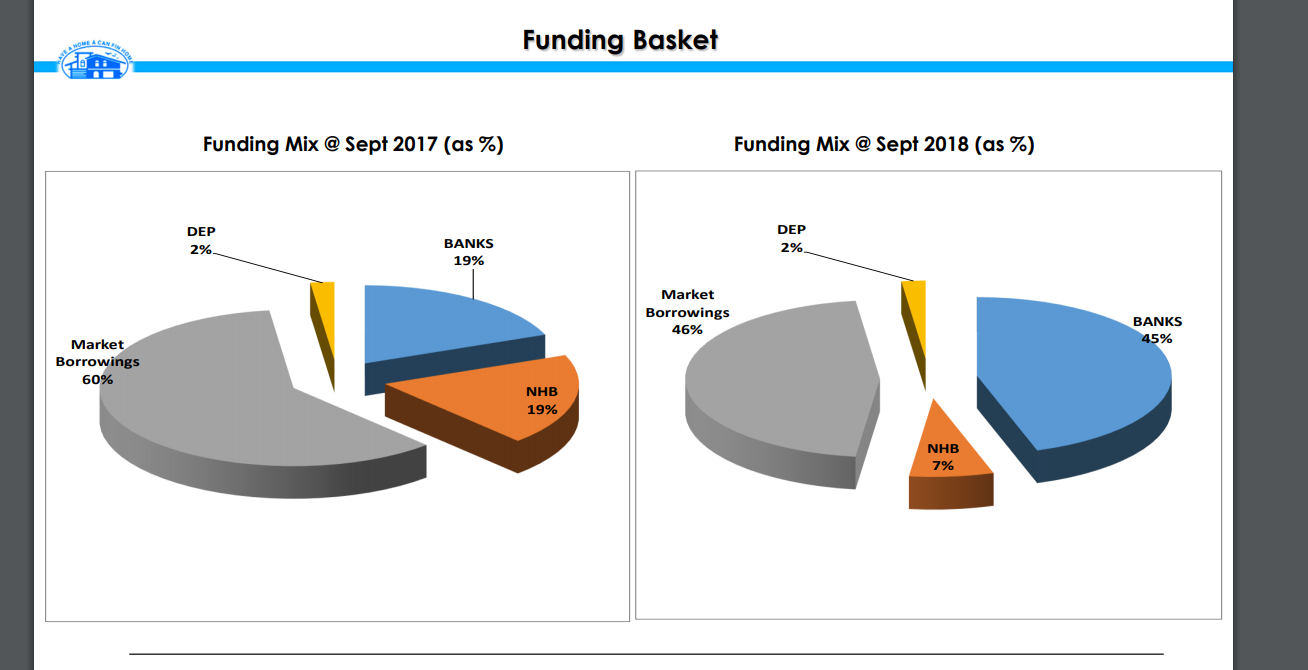
Market borrowing went down from 60% to 46% and bank borrowings went up from 19% to 45%.
Final observation regarding, NCDs →
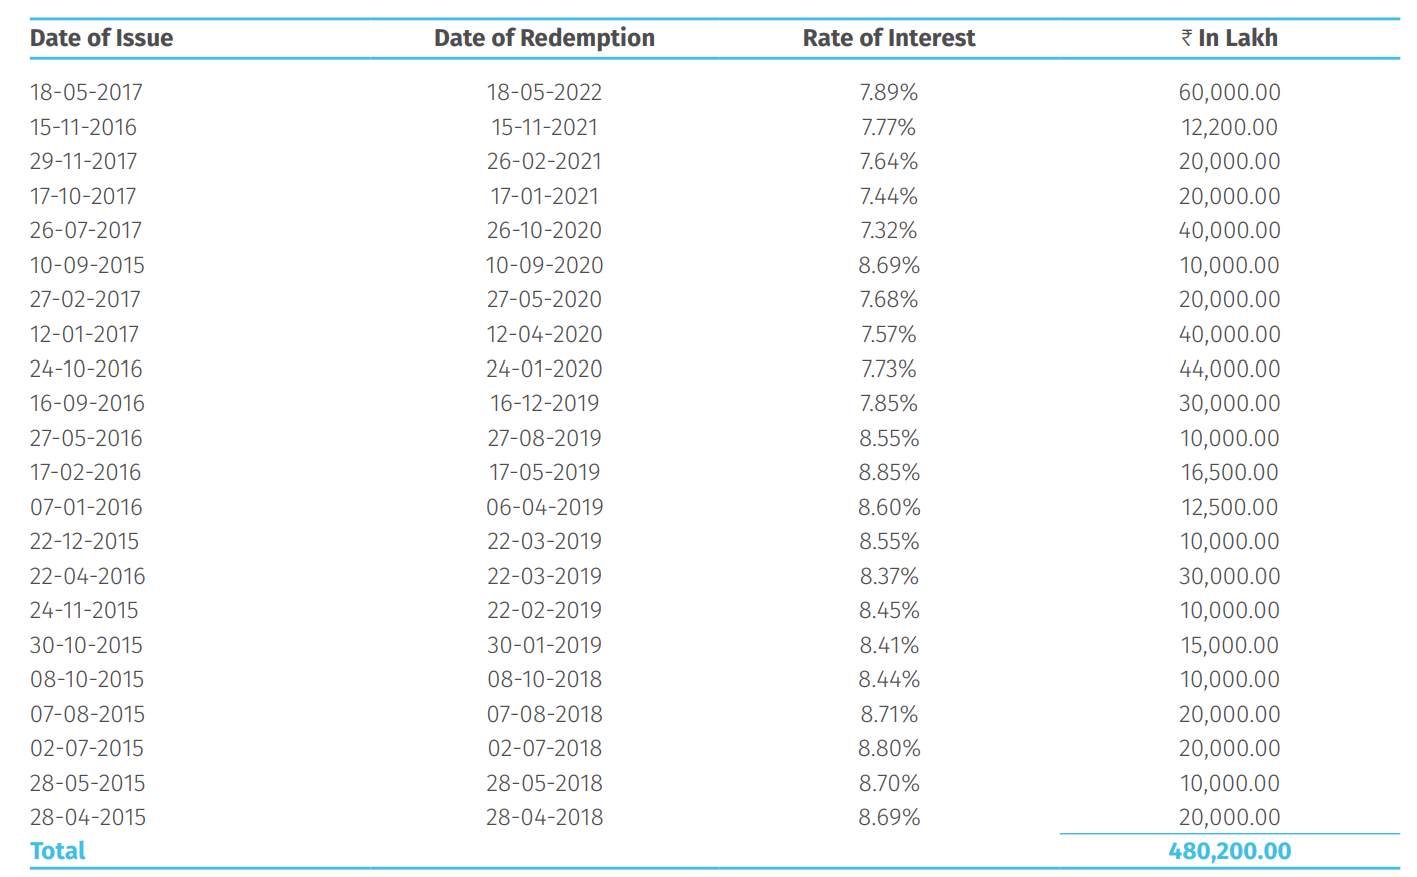
The duration of NCDs for ranges from 2 to 5 years as per AR18. They have managed to raise quite a bit of funds with 5 year NCDs. The NCD rates will go up further resulting in margin pressure. But impact from CPs on margins might be much higher.
In summary, CFH is a company that has done good job on asset side in terms of asset quality & loan book growth might go up due to newer branches & lower rundown rate. But margins might remain under pressure due to replacement of CPs with bank lines & rising yields.
I will continue to track CFH for few quarters in terms of growth & ability to hold on to margins within reasonable range before taking any call.
Disc - CFH forms < 3% of my portfolio, no transactions in last 60 days. This is not a buy/sell recommendation, investors are advised to do their own due diligence.
25 Likes
Hello,
What exactly is meant by ‘balance transfer menace’?
Thanks.
It means transferring balance of the loan from one account to another or one institution to another usually to take advantage of lower interest rate or better terms of loans.
2 Likes
India Ratings and Research (Ind-Ra) has revised Can Fin Homes Limited’s (CFHL) Outlook to Negative from Stable and affirmed the Long-Term Issuer Rating at ‘IND AAA’ while resolving the Rating Watch Negative (RWN).will this make cost of fund higher ??
https://www.indiaratings.co.in/PressRelease?pressReleaseID=35160&title=india-ratings-revises-can-fin-homes’-outlook-to-negative%3B-affirms-‘ind-aaa’%3B-off-rwn
HIGHLIGHTS FOR Q3
Disbursements during 9m of FY19 amounted to Rs.3,925 crore
Q3 FY19: 1318Cr, Q2FY19 : 1443 Cr, Q1FY19: 1164 Cr
Loan Book Growth in FY19: Rs. 1,826 crore (vs Rs.1745 crore in 9m of FY18)
Loan Book reached Rs.17568 crore with a clientele base of 1.40 lakh
Y-o-Y Loan Book growth of 16.67% despite a sluggish growth in our home state.
Minus Karnataka, Fresh approvals: +6%, Disbursements: +11%, Loan Book: + 22%
PBT & PAT for Q3FY19 rose by 11% & 13% resp (Y-o-Y); For Q3: PBT +16%, PAT +21%
NIM: 3.18%, RoAA*:1.88%, RoE*: 21.43% and EPS: Rs.17.46 * Annualised
Cost to Income Ratio: 14.04% contained below 15% (vs 15.29% at Dec’17 & 15.21% at Mar’18)
Gross NPA & Net NPA at 0.71% and 0.51% as against 0.63% & 0.42% at Sep’18
88% of fresh loan approvals during 9m of FY19 were for Housing & 12% for Non-Housing
66% of fresh loan approvals were to Salaried & Professionals while 34% were to SENP segment
72% of the outstanding loan book as at Dec’18 comes from Salaried & Professionals; 90% from HL
1 Like
SK Hota confident - https://www.youtube.com/watch?v=VGIwWVibEow
Their presentation also suggests:
-A comprehensive branch count of 230 by FY20.
-Revised Fy 19 target to 18500 Cr from 19500 Cr loan book.
-Major focus on Tier 3 and 4 cities for profitable growth.
-Difficult to get profitability from metros due to banks and other competition.
Even the revised target of 18500 is difficult to achieve. I think Mr. Hota should under-promise & over-deliver instead of doing it the other way
NHB’s new rules for HFCs will force many to revisit plot they occupy now
NHB’s new rules for HFCs will force many to revisit plot they occupy now
The National Housing Bank’s (NHB) move to tighten capital adequacy ratio norms for housing finance companies (HFCs) will force many to revisit the plot they occupy now. Although the proposed regulatory changes would not adversely impact the stronger among the lot, many HFCs at the capital adequacy ratio threshold of 15 per cent or less will need to infuse more equity to grow at a reasonable rate in the future.
“The message the regulator is trying to give is that there are circumstances which have forced it to make HFCs more conservative in their credit delivery. As for HFCs which have a capital adequacy ratio of over 15 per cent, they might have to raise capital for not just shoring up but for growth,” says Ashwini Kumar Hooda, deputy managing director of Indiabulls Housing Finance. Adds Manish Jaiswal, chief executive officer at Magma Housing Finance: “It will address systemic risk of capitalisation and leverage at a sectoral level, but at the same time it might impact the return on equity (RoE) specifically for some large HFCs which are over-leveraged with thinner return on assets.”
Currently, leading HFCs Housing Development Finance Corporation (HDFC), Indiabulls Housing Finance, Dewan Housing Finance (DHFL) and Can Fin Homes are well placed and it’s unlikely they will get affected in a big way, but for minor compression in net interest margins and return on equity. PNB Housing would need to infuse additional capital as analysts expect the leverage position of the company to cross 14 times in FY22 due to faster consumption of tier-1 capital. Though, LIC Housing, and DHFL are also highly leveraged, their book growth has moderate as compared to PNB Housing. Thus, they may not need to infuse the capital in the near term.
What’s in store?
Analysts believe the move had to be brought about to align HFCs with the wider universe of non-banking finance companies (NBFCs) which cater to a clientele largely not serviced by banks and whose books are seen as risky; and therefore, a capital adequacy ratio of 15 per cent. The mess at the Infrastructure Leasing & Financial Services; and the knockdown effects at HFCs like DHFL were the other factors at play.
NHB has proposed to raise the capital adequacy ratio of HFCs and cap their borrowing at 12 times their net-owned funds (NoF) in a phased manner by March 2022. The capital adequacy ratio will move up in a staggered manner — to 13 per cent by FY20, to 14 per cent by FY21, and 15 per cent by FY2022. Similarly, the proposed cap on borrowings is up to 14 times of NoF by FY20, but taper off later to 13 times by FY21, and 12 times by FY22. The amount of public deposits that deposit-talking HFCs is to be capped at three times of their net worth. Currently, HFCs maintain a floor capital adequacy of not less than 12 per cent, while their borrowings are capped at 16 times their net worth.
In case of deposits, HDFC and PNB Housing have good chunk of total deposits. As of December 2018, deposits accounted for 30 per cent of total borrowing of HDFC and about 17 per cent in case of PNB Housing. However, as per analysts at Motilal Oswal, the ratio of deposits to NoF stands comfortably at less than two times based on FY19 estimated figures.
Analysts are of the opinion the cap on borrowings for HFCs will certainly deleverage the sector, but it’s important to put forward a structure to prevent a liquidity crunch. “The regulator is saying that you need to keep much higher capital upfront. Whether you do home loans which carry a risk weight of 35 per cent or loans against property with a (risk) weight of 100 per cent,” says Hooda. He adds: “While developers have higher delinquencies, the interest rate charged is also higher (than retail home loans). As a result, one is compensated for the extra credit cost.” HFCs had grabbed market share from the banks for both developers’ and retail home-loans, but the IL&FS fiasco had created a liquidity freeze; it’s unlikely they can do so from banks in a big way going ahead.
The Rs 9.3 trillion HFC industry is growing at a compounded annual growth rate of 25 per cent and has direct impact on sectors such as real estate, cement, steel etc, which generate intensive labour employment. “Both credit and its cost of cost credit will be key primer for overall GDP growth," notes Jaiswal. According to analysts, as the leverage of the HFCs is expected to come down, this would impact their net interest margins by 5-10 basis points even as it sets barriers for the entry of new players.
Source:
1 Like
Latest Investor Presentation
Q4 results:
Revenue up (463.05 Cr vs 399.49 Cr)
Interest cost up (314 Cr vs 255 Cr)
PAT down (67.01 Cr vs 75.46 Cr)
Employee cost up (16.33 Cr vs 12.80 Cr)
Other expenses up(15.29 Cr vs 11.84 Cr)
Margin down (25% vs 28%)
EPS up (5.09 vs 2.83)
In first attempt they lost almost 50% market cap (from peak), now we see another attempt… let us see if the bride can find suitable groom
12c62436-c946-4e01-bc85-b4aca74d0d14.pdf (150.4 KB)
Got the link, sorry. Thanks
Akash Bhansali in shareholders name in the annual report