
Guys, too much of futuristic projection of chart pattern is confusing & looks like a shot in the dark. This is unwanted. Please put charts where the patterns are in place and breakout has happened or is about to happen. Also fundamental correlation or future fundamental triggers should also be discussed. Hope everyone follows this discipline.
8 Likes
ok sir point taken…
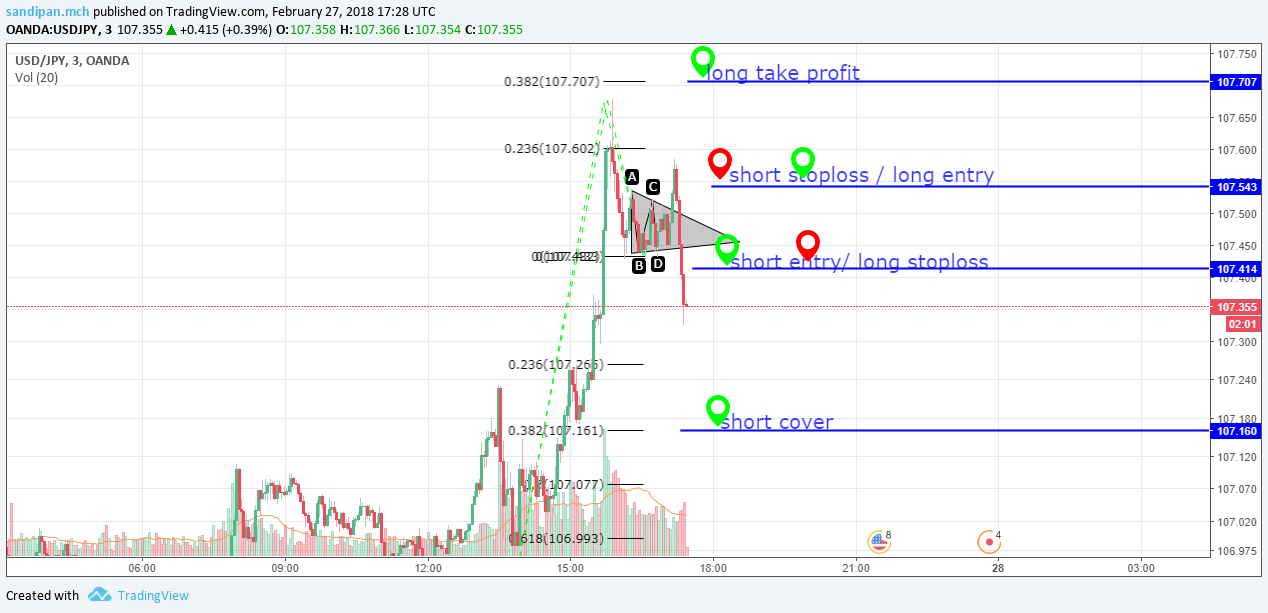
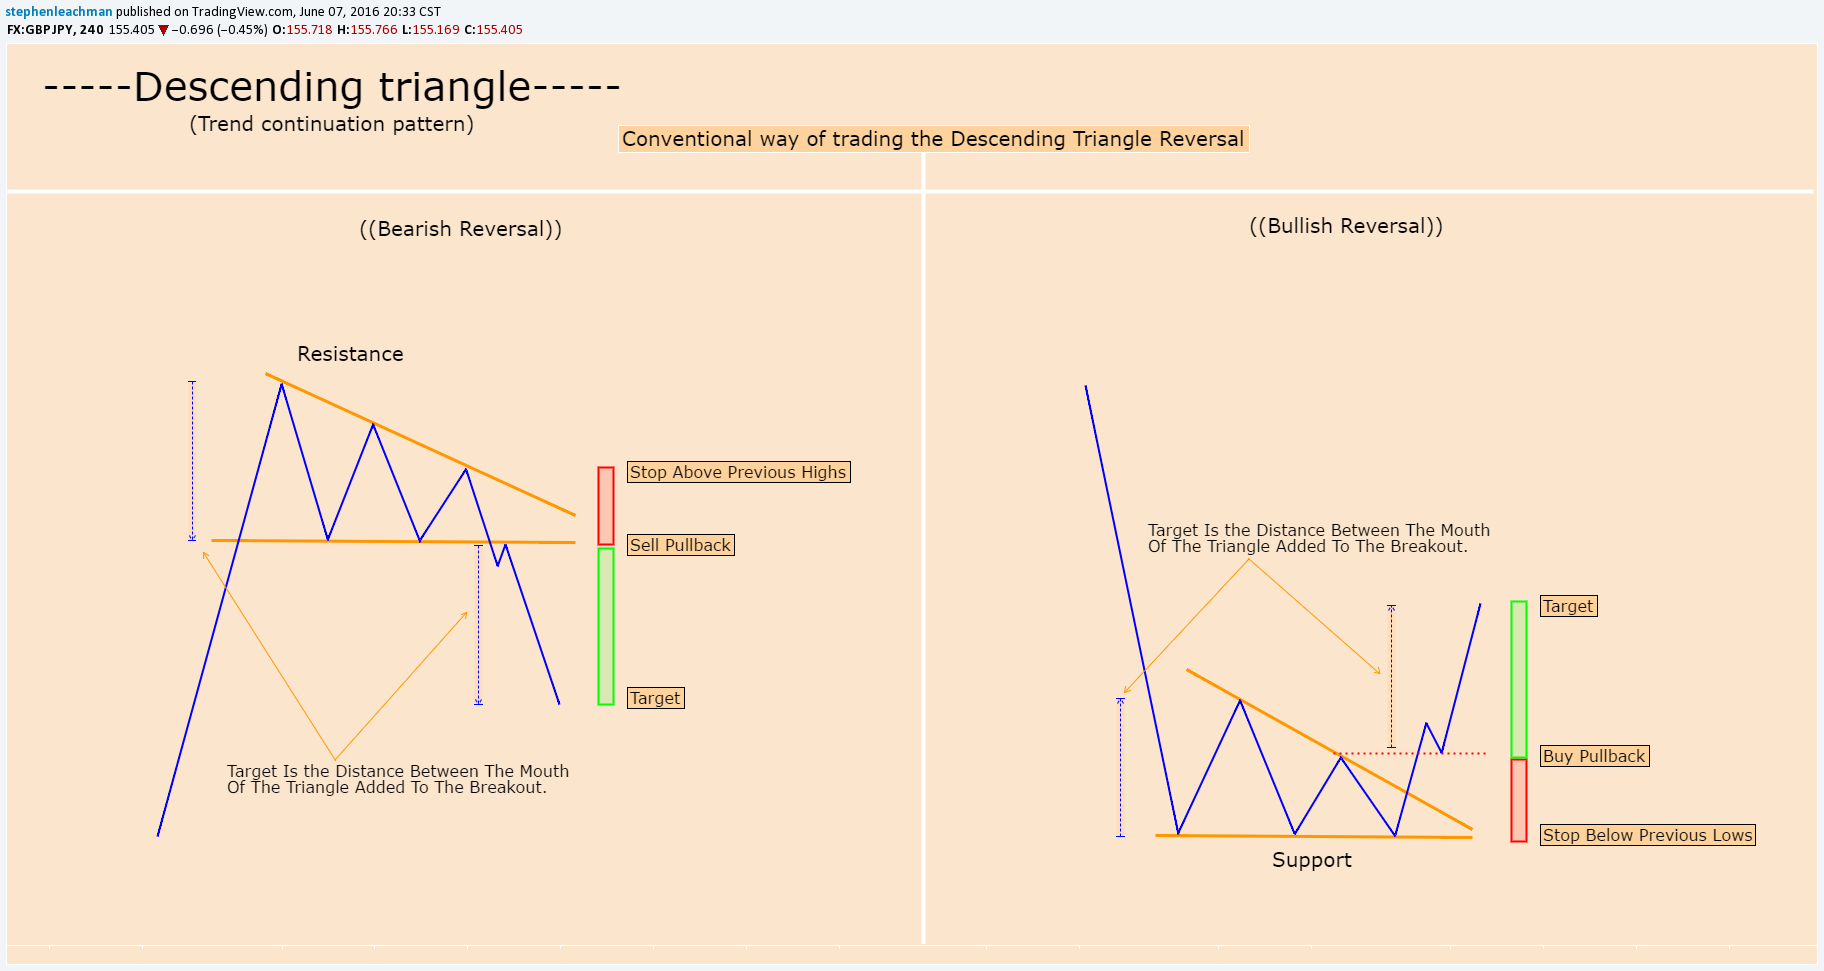
Is there any rule for descending triangle breakouts or breakdowns??
What looked like a initial breakout quickly ended up being something very else…!
How to minimize risk by taking correct break out positions while investing in a scrip, with stable fundamentals?
guidance anyone?
Just for example this was a very much possible bullish breakout…

Hi Group Members,
wish to learn harmonics, seek suggestions on books and links for resources.
also interested in derivatives, till now only exposure to cash.
thanks…
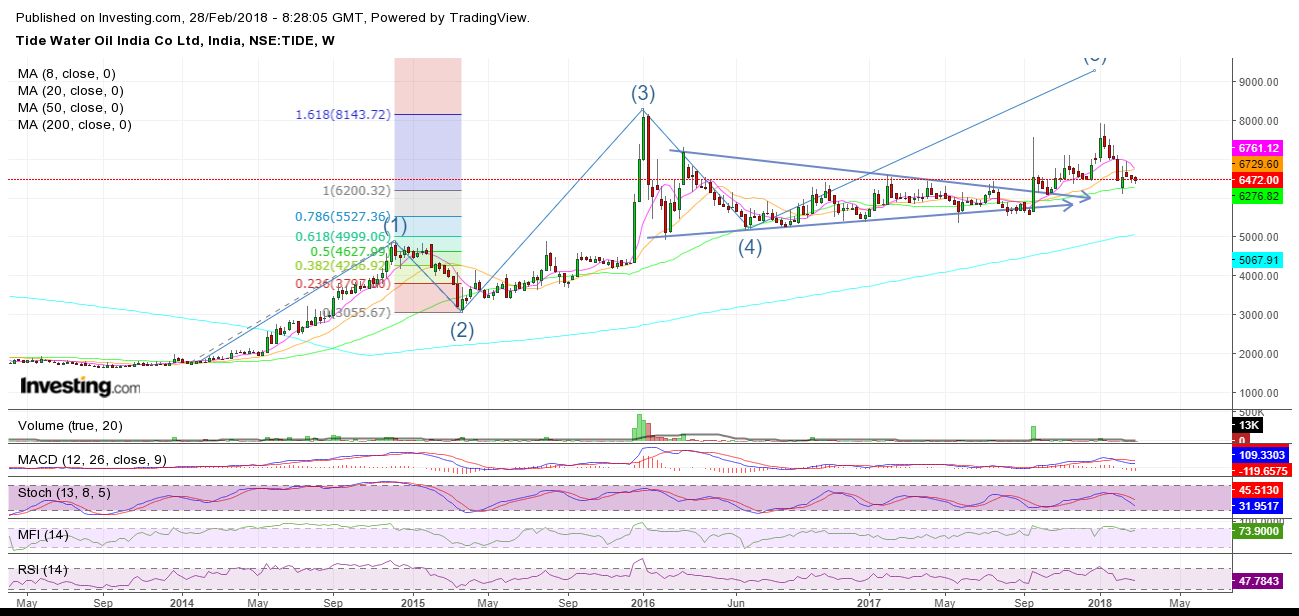
Many patterns visible in one. Elliot wave 5, started, descending triangle pattern, rounding bottom, or a cup and handle. need to keep watch, which will one will emerge finally…
1 Like
Risk minimisation is a function of money management and increasing probabilities (more reward to risk) while entering into a position (a transaction for a particular stock).
Now breakout trading
Breakout trading refers to ‘breaking out’ or burst through a ‘new territory’ from ‘somewhere’ through ‘influential buying’. You can see four elements in bold here. Now let’s define them now:
Breaking out- meaning price shoot through on a particular day. How to define price appreciation?
New territory- the price has reached a territory or zone which has broken mentality or behaviour of participants (buyers and sellers). How to define new territory?
Somewhere- the breakout has to happen from launchpad. Whether the launchpad is constructive or not is another issue.
Influential buying- whether a good section of participants believed and participated in the breakout activity.
Before we define further few of these things, let’s go back slightly a bit towards more towards a simplistic view:
- Stock market is a place to buy and sell shares.
- Stock market is driven by forces of nature. Like any human or animal, we all are driven by forces of nature. Whether it’s physics (momentum, gravity, rotation) or medical science (neurons, compartments of brain, heart etc).
- Consistent momentum for a long period sets a trend or direction.
- Stock market is a place of probability not certainty. You cannot buy anything (long or short term) with certainty, no matter what your research is.
- Maximum adversity beats you down to a winning probability less than 60% for best of breed. Below average like me hovers around 40-45% winning maximum.
- When people pay a higher price for a stock it goes up.
- When people joins in queue (bids) to buy a share a momentum sets in. Force of nature ensures momentum continues unless over ridden by another act which leads to reversal of force of nature.
- Stronger momentum requires more forces. Here it is volume which can be provided by big buyers supported by rest of crowd. In India due to high promoter holding and low float HNI plays a big role other than institutions for volume action.
- Forces of economics ensure engagement and disengagement of buyers and sellers both. Volatility increases when they engaged, it reduces on disengagement. This is popularly called constructive price behaviour in stock market.
When a momentum sets in you can buy either: a. on the breaking out day b. follow up buying as long as you feel momentum is intact above new territory. This includes even at the time of pullback (called pullback trading)
An appreciation should be sufficient to take the price beyond line of least resistance. This is a price to a new high including all time high. This price passes through a point which demarcates old crowd behaviour and new behaviour, popularly known as pivot point. The appreciation has come either prolonged inaction or continuation of buying (launch pad).
Now task items:
-
Do not look for pattern everywhere unless you understand whether you want to catch momentum. Say for breakout trading momentum is a must. So, go for the stocks where price has appreciated to some extent i.e. say 30% or more 3 Months, OR 50% or more in six months.
-
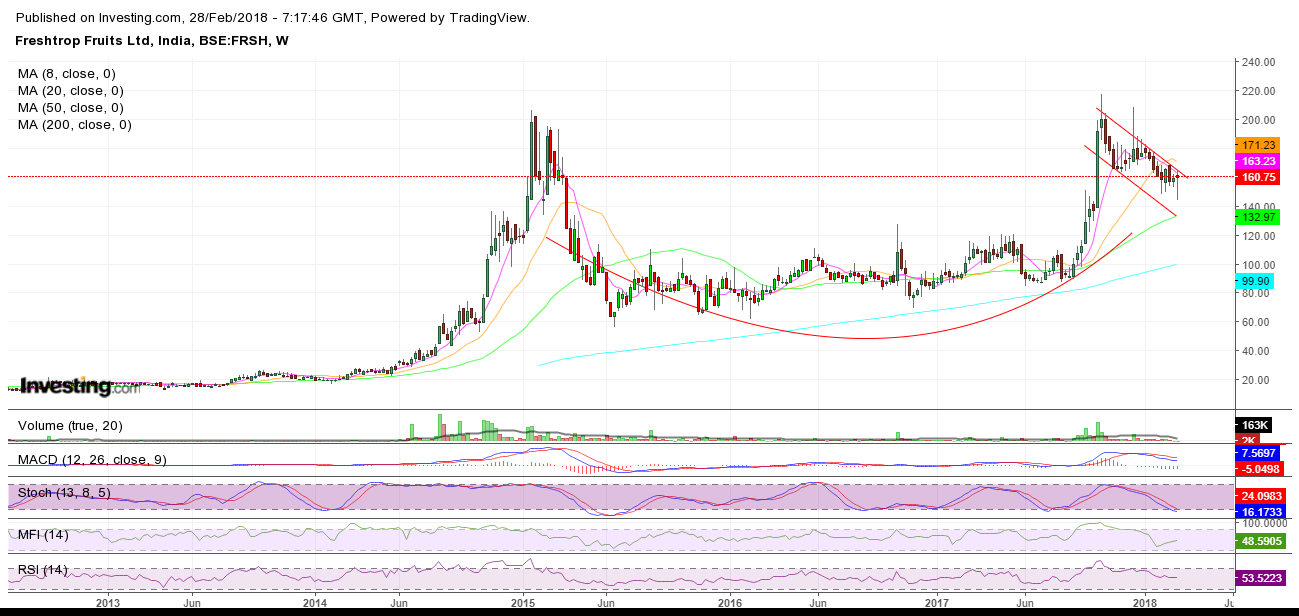
Speculation alone can not ensure a long-lasting momentum or trend for ever. Where speculators desert a stock for greener pasture stock lost its trend. But when a trend is supported by both investors and traders it becomes enduring. So, look for stock which have a primary trend in your support (here uptrend). Primary trend can be determined on a long period. I take 5 years as maximum (3-5 Years) considering political changes. A 3/5 year chart with weekly unit will show you whether primary trend is up and down.
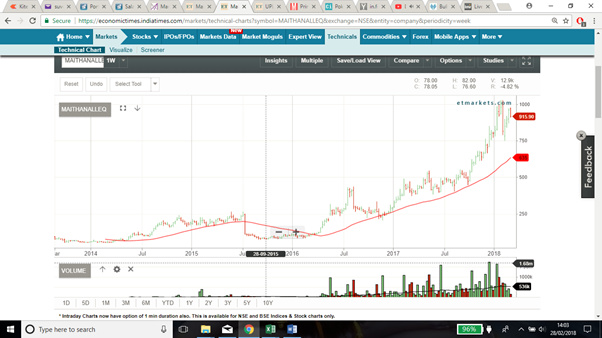
See above, on most of right side stock is moving up i.e. making newer highs and higher lows. Thrice it has touched 40WMA (equivalent of 200DMA) and bounced back. A strong trend indeed. Why 200 DMA? It’s a reflection of yearly trading averages. Why yearly is important? It’s a key decision-making time period i.e. financials, budget, taxation etc.
- It’s fantastic that there is an uptrend. But is it too late? Are we late to the party? What is strength of trend? Can we rely on it? Many people use many variables to ensure trend is early and trend strength. I am regular user of Stage analysis (Keynes economical pattern) and Base count (Bill O Neil statistical repetition pattern) and multiple moving averages (fractals to use larger crowd groups using divergence as tool).
Stage analysis- Keynes said economics or human, everyone goes through stages. So, a stock consolidates (stage 1), move up (stage 2), forms a top (stage 3) and goes downward (stage 4). It keeps repeating all the time (1-4).
Base count- Bill O Neil dissected 100 years of upward movement (Stage 2) and saw every stock forms between 3 to 6 bases before topping out. In fact part of Jewels project, we could get more or same number in India. Cyclical companies are the ones which shows inconsistent behaviour in bases but minimum 3 which you can count. Now if you buy a stock base 4 or 5 you know late to the party.
Fractals- fractals is a shape of geometry (either curve, figure etc) which can be presented visually or even virtually. Scientists realised humans while using brain has the ability connect different and inter dependent abstracts to form a whole visual picture. Here there are individual moving averages, what you do is clubbed them into groups (traders and investors) and see how they behave. The behaviour can be interpretation through visual chart. You can determine without using fractals. Say CMP (Current Market Price)>50DMA>150>200DMA as simple arithmetic. Fractals is a useful tool for enabling right brain thinking.
So, above example, whether trend is strong? See for yourself:
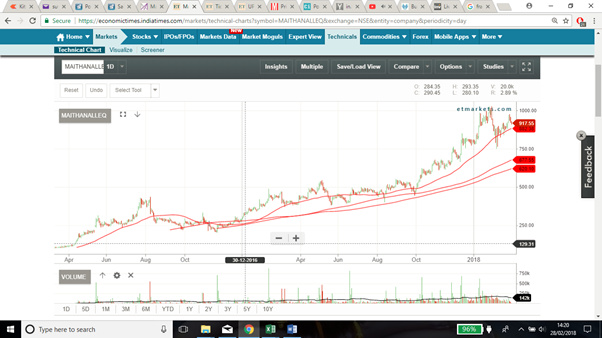
Look how beautifully and seamlessly the DMA lines are moving together. Let’s see what fractal says:
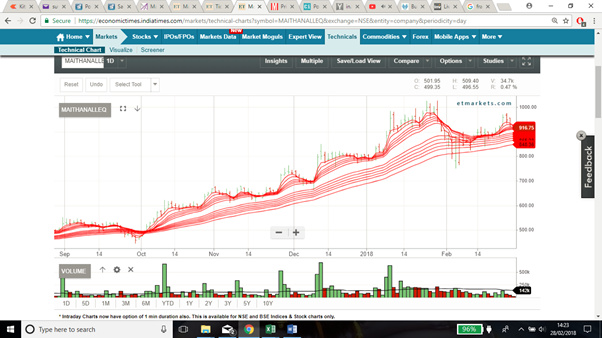
Five things you can make out:
Traders (short moving averages)- the lines (top six lines) moving consistently with gap between them for most of time. What does this mean? When traders pay higher price, lines will separate (as moving averages goes up) and when they agree to common price it will contract. See the contraction towards end. But still traders couldn’t dent or move through investors (long term moving averages) despite a general correction market.
Investors: well separated and expanding, they believe in story. They continue to buy whether market corrects or not.
Rebound: Few times when trader contracts (agree to a price) immediately they differed and started paying a high price. The lines rebounded up wards.
Volatility- four or five times traders has contracted and expanded in one year. There has been hardly five swings without cutting investor perception. This is a definitely a low volatility stock.
Trend strength- look at the gap between traders and investors. Fairly consistent and widening except towards end, but you can see again gap is opening up. Very good trend strength.
Fractals require bit of research and practice, I would suggest you create your own fractal.
- Now we know trend is strong. This means if we enter our probability of winning is increased nothing more. But there is no guarantee that you will make money, what is the precision timing to enter a stock. Again, different patterns and fractals. I use a breakout from constructive base pattern beyond a pivot point.
Constructive base pattern- I discussed in earlier posts, any healthy economics which involves both influential and retail buyers will expand and contract without loosing its base. One or two shakeouts is ok, not complete breakdown. See those green lines and red lines. How price is contracting, look at volume below for contraction.
Pivot point- this is the most confusing and precision point. Jesse Livermore called this as line of least of resistance. I use this (still infant): if a stock breaks above a zone where there are no trapped buyers. Meaning a point where there are no old buyers who are sitting on loss and crying to become desperate and get out. If there are they will not let the price goes to a new high.
I know I could not have explained everything so easily. Actually, I opened a thread for all this, updated till money management. Not able to prioritise further.
In a nut shell we can understand:
- Patterns arise while assessing trend strength, direction or character.
- Buying point patterns are different from point 1. These are more precise, patterns are normally avoided.
- Fractals help in co-relating multiple data and visual thinking towards a story building, otherwise called right brain thinking.
Happy to help you further, you can connect any way you want. I saw somewhere you mentioned you are grappling some of concepts. Multiple fractal you are using at so early stage, it will harden your wiring and liberate you much faster. It’s a question of time. Trust me I still talk and meet much experienced people whose wiring is so hard, untenable to circumstantial changes. That mean a disaster is waiting somewhere (not necessarily financial disaster).
Good wishes and best of luck
5 Likes
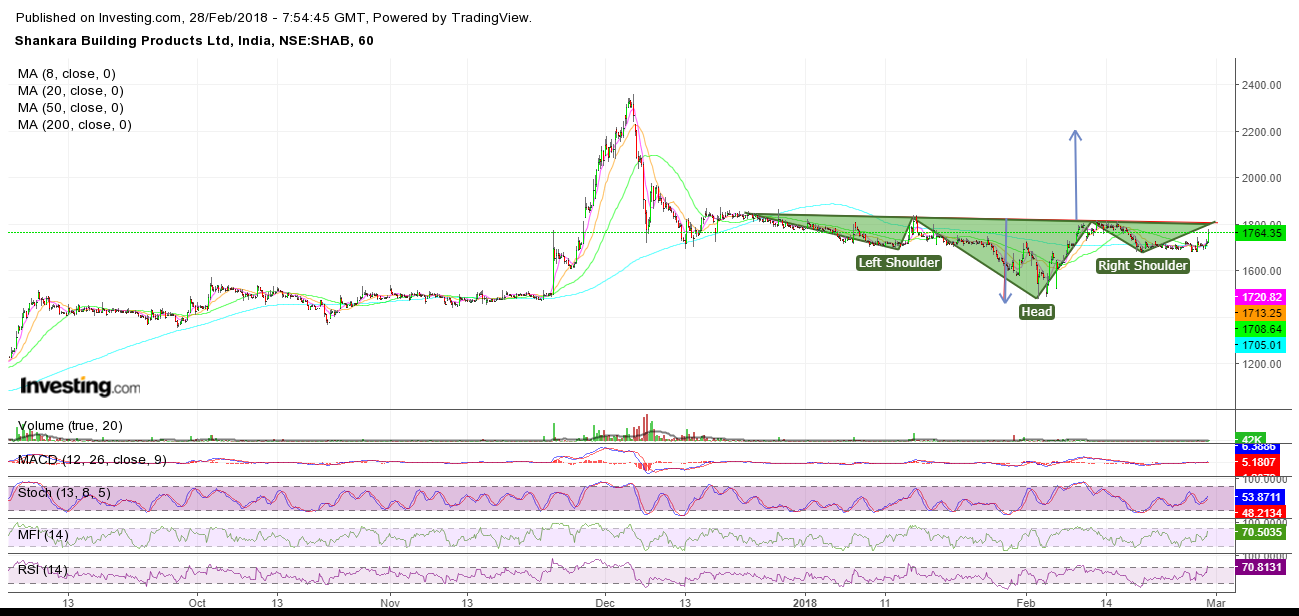
I think u should confirm head and shoulder with volume changes… Please show the volume graph and also any fundamental development acting behind this pattern ?
No thats not a proper base at all…
Look for vol or monentum cupping also along with price cup… What i havr experience cups with depth greater than 33percent has higher failure rate… And also cups taking too long to form are too sloppy ti breakout… Check out willian j o neils description on cup and handle and other pattern in the book called how to make profits in stocks…
For harmonics, scott carneys Harmonic trader vol 1 to 3 is enough i feel…
Also take a look at a very old text of HM gartley’s book Profits in stock market…
All the best…
For harmonics carney has his own youtube channel , link ti which i mentioned a few poats back, that will also be helpful
can somebody kindly help me understand the current correction that is happening in Meghmani by juxtaposing it with the patterns discussed provided if the trend falls into any one of the above categories.
Kindly ignore this message or you can delete this if it one of a offshoot and somebody feels it is irrelevant to be under this topic.
Disclosure: Invested huge quantity at 114 and new to stocks.
1 Like
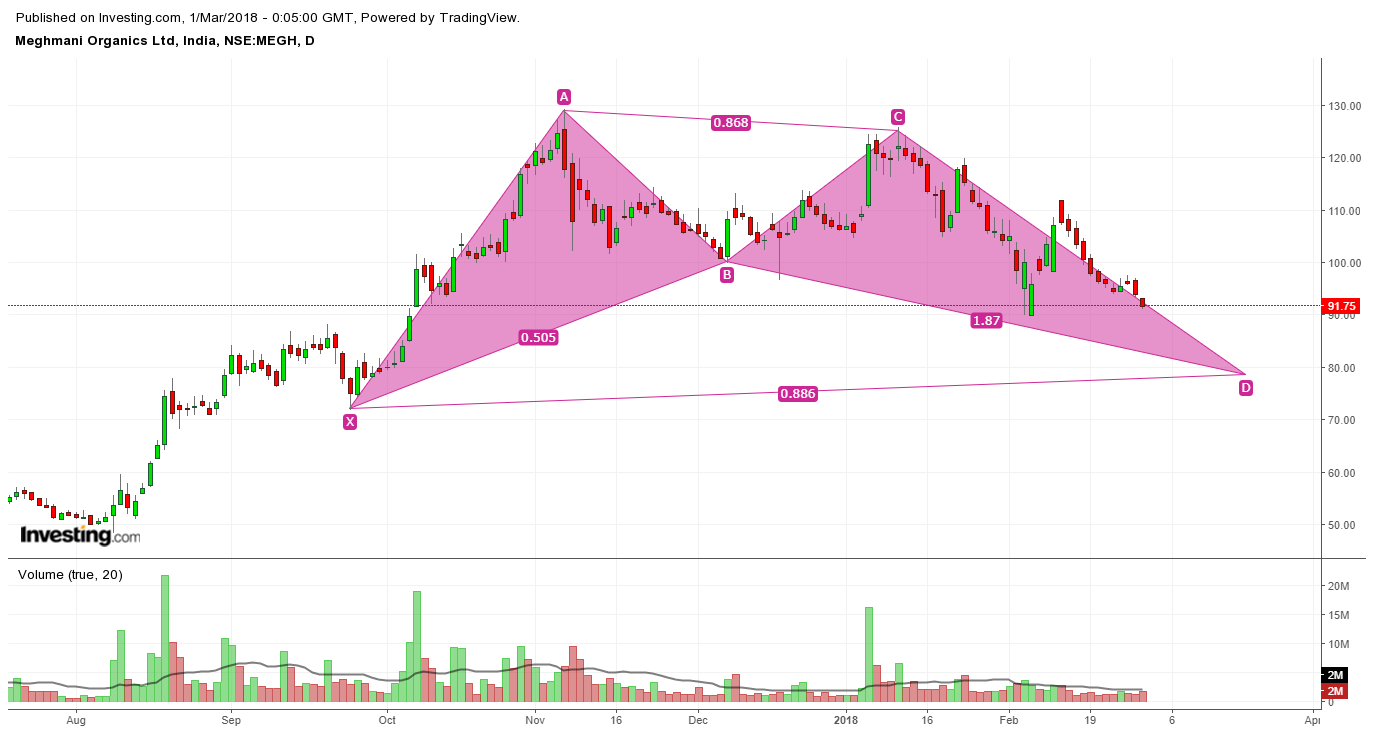
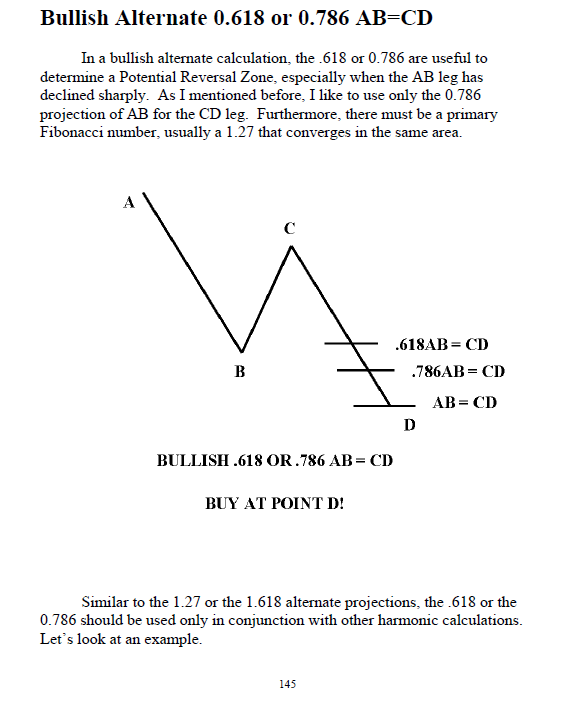
Check this. It could be the bullish bat here.
Also it’s now in Elliott Wave 4 correction. According to bullish bat, it might correct up to 75/80. Or it may even stop correcting at 90 and start wave 5 impulse move.
@duranvskp
If you are new to stocks, keep at least four things in mind. Firstly invest in good quality mutual funds for long term, and allow the money to grow there rather than experimenting in stocks. Secondly read, read, and read about investing in stocks. Thirdly invest in companies with good business, reputed management, and low debt—with few percentage points of your funds. And lastly fear and greed are biggest enemies of investors.
Regarding Meghmani Organics technicals, a bullish bat is in formation here. That means the prices may move up from here but after touching certain levels that is called PRZ or potential reversal zone. That PRZ is around D point in the chart. The emphasis is on potential. That means that is the level from where there is a high possibility of reversal. But prices may or may not follow technical charts. So the price can reverse from any levels, as suggested by @PE_Ratio, they can reverse from current levels also. This is the bullish bat pattern unfolding in Meghmani Organics.
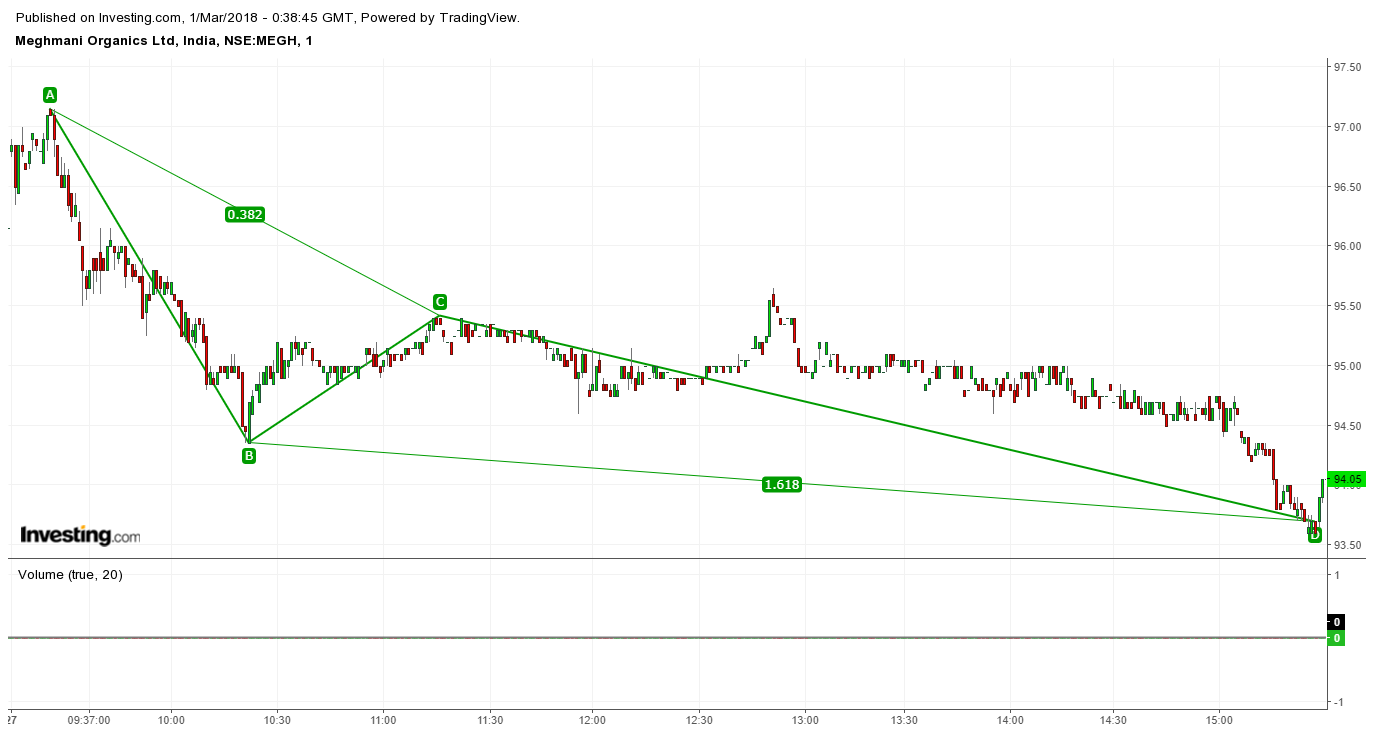
I have also come across a 0.382 pullback and then extreme price action in daily chart of MO (27 Feb 18). The prices ended precisely at 1.618 BC projection. Look (after C point) at rounded bottom, or a cup and handle breakout, or a flag breakout. But these breakouts failed, and price action continued in the original direction till it reached 1.618 zone.
@duranvskp I am not in a position to give you a specific advice regarding what should you do about your investment in Meghmani Organics. The decision to hold or exit the stock should be your own.
4 Likes
@The_Confused_Consult
Very insightful post. You have beautifully explained your concept. I have only one query though. How to make fractals? I have tried at https://economictimes.indiatimes.com, but I could not find the option for fractals. kindly help. Thanks again for you post.
Accumulation / Distribution line break out
Hi,
Here I am discussing another type of breakout which I feel is very significant as the price break out or even more important. Break out on an accumulation distribution charts. I have done a detailed study for various periods in the markets from 1997.
For this I calculated accumulation distribution and plotted an AD line. Calculated as follows
Money Flow Multiplier = ((Close – low)-(high- close))/(high-low)
Accumulation/distribution = volume x money flow multiplier
A/D line = Prior A/D + current accumulation/distribution
This AD line is plotted against time axis. It has been seen that whenever there is a break out in accumulation level of the existing trend or break out of a previous highs in accumulation levels that indicates the start of new bull trend. It has been seen that price break out happen a long after this. The level of accumulation reaches or crosses previous highs means a lot of smart money is coming into the markets at the lower levels and stocks are accumulated by strong hands. I feel this can be a very good indicator for bottom picking. (At least history says, not a guarantee for future).
If one was following these charts he/she would’ve been able to enter the markets at almost the bottoms in 2009, and also in 2004 just before the start of the bull rally which ended in 2008. I clearly believe that the level of accumulation is the most important indicator of the strength of markets.
Here I have done breakup of the charts for different periods
1997 - 2001.
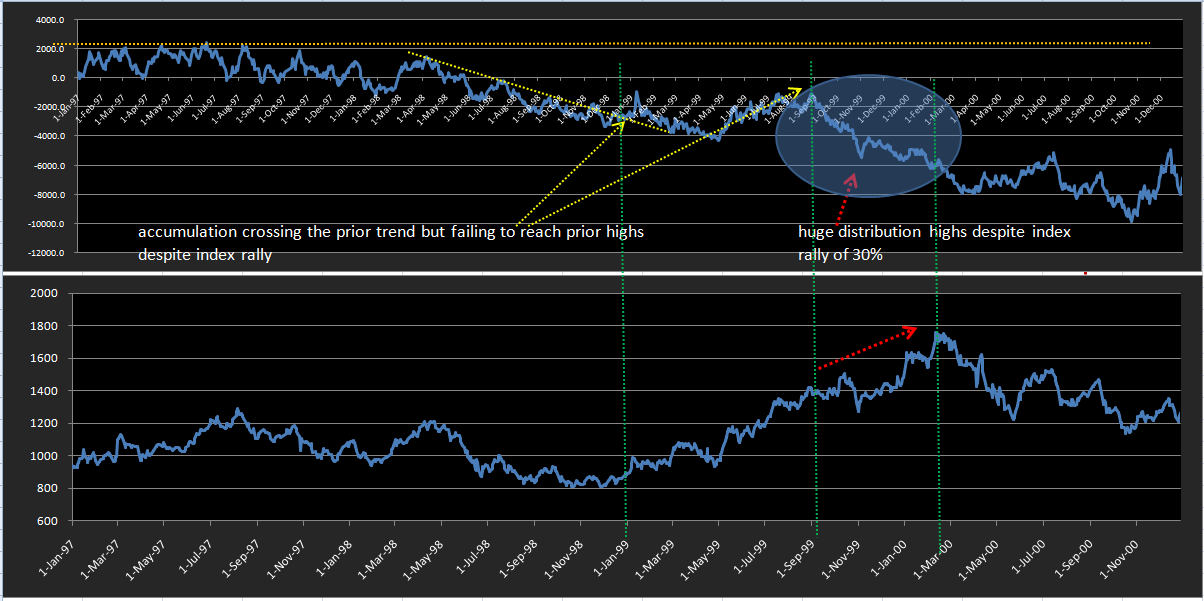
From the charts it is clear that during the entire year of 1997 the accumulation was range bound and by 1998 markets started distributing and by January 1999, the trend in the AD line was broken out and nifty was at 1000 range. Then the rally in nifty stared soon to 1800 but the level of accumulation had topped in September 1999, when nifty was 1400 levels. But this level was way below the previous highs in accumulation levels. Nifty still went on rallying a 30% further but this time with huge distribution. This means market had shifted from strong hands to weak hands. When market entered into a bearish phase it lost 50% and the bear phase continued for 3 years.
2003 bottom formation
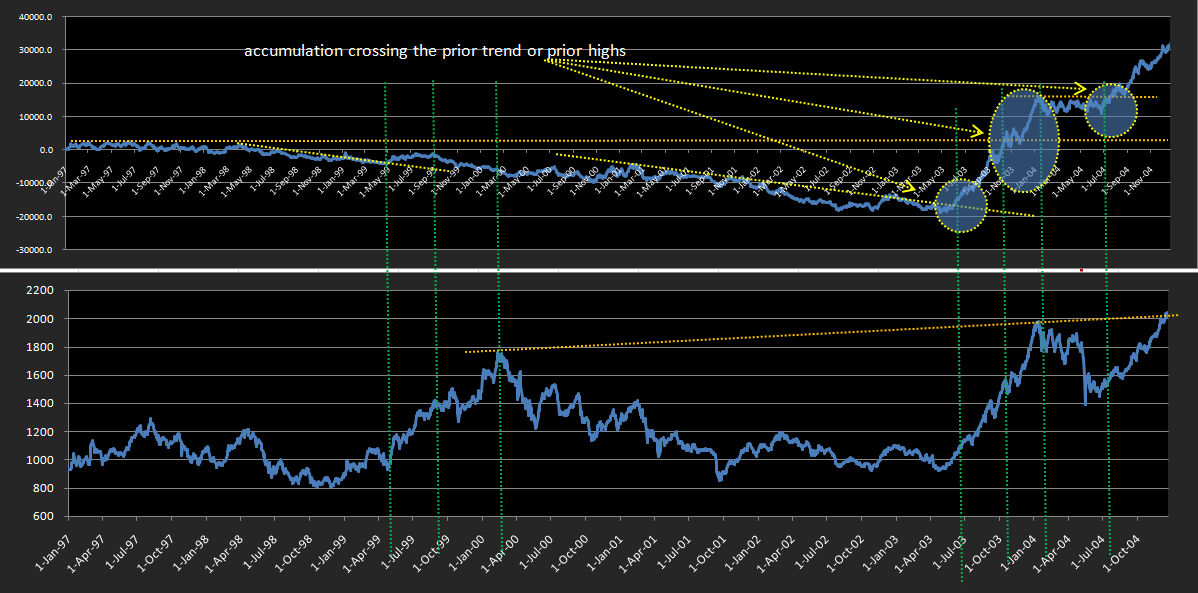
During the 3 year long bear phase no significant accumulation was seen. In july 2003 there was a breakout seen in accumulation levels in the AD line chart when nifty was at 1000-1200 levels. During the rally started in July 2003, the accumulation levels has crossed the previous highs in November 2003 when nifty reached 1600. The rally continued further till nifty reached 2000 levels that too with good accumulation.
2004 Dip
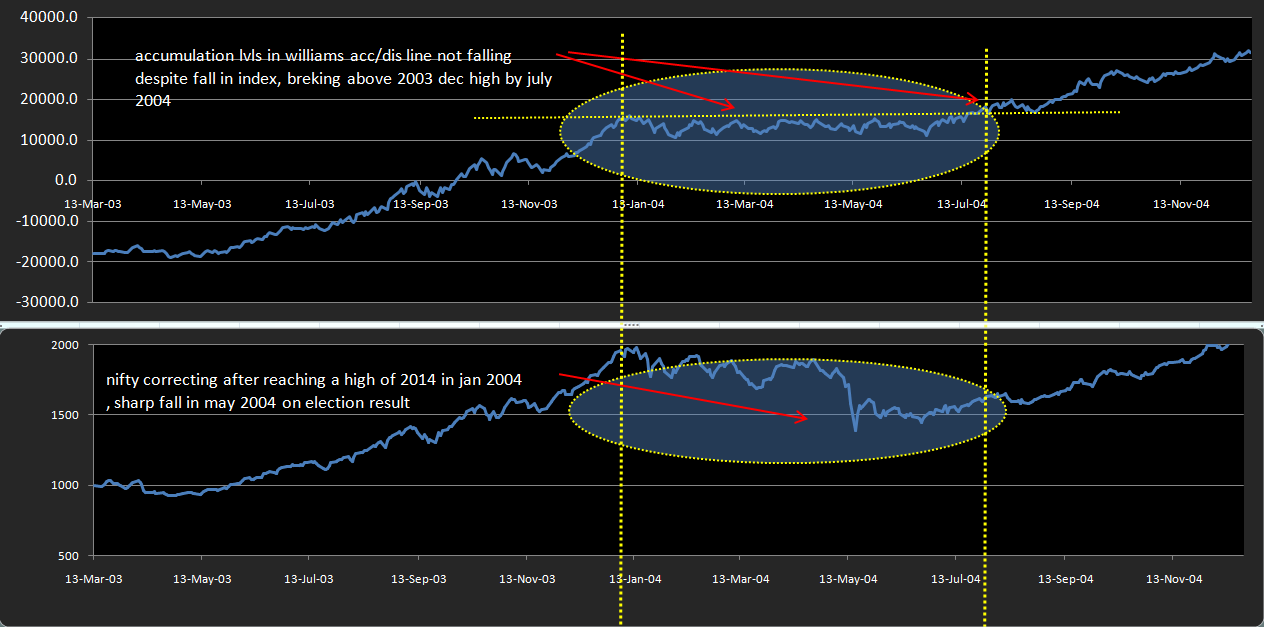
Nifty fell almost 30% due to unexpected defeat of NDA in 2004 election. But from the charts it can be seen that there was no significant distribution during that period and the accumulation crossed the highs of December 2003, by July 2004 when Nifty was still at 1600 levels. Then nifty rallied till 6300 in 2008.
2008 Market crash
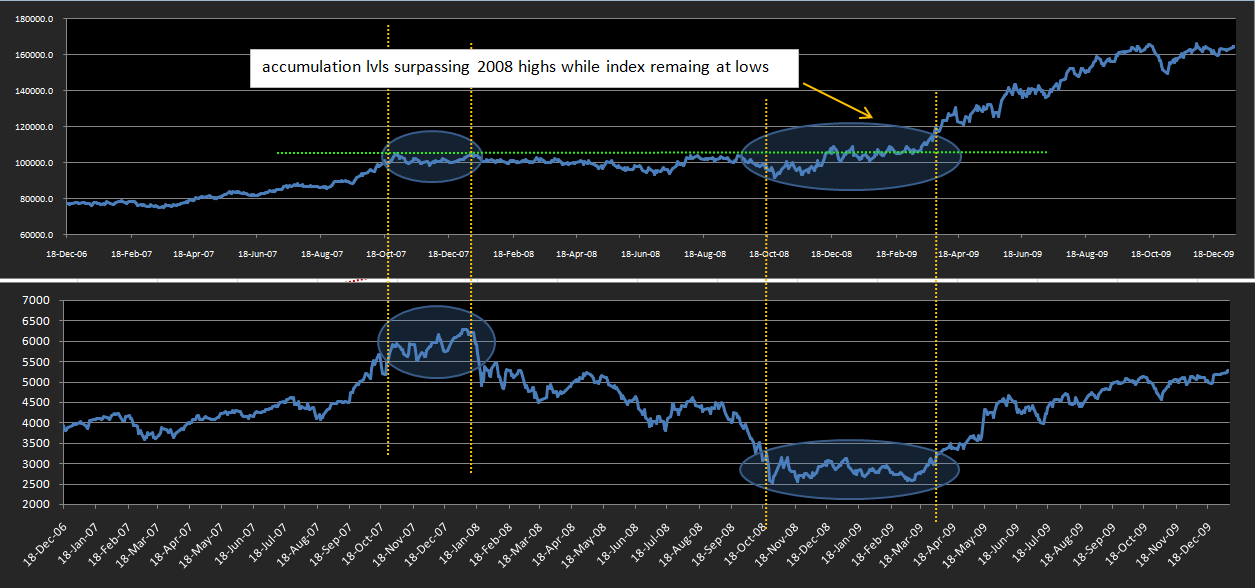
During the market crash of 2008 nifty lost almost 60%. If we look into AD line charts it can be seen that during the period between 2008 December and 2009 March, the accumulation levels has crossed the 2008 highs, while nifty was still at 2500-3000 levels. Nifty rallied to 6300 in 2 years.
2010 Correction and 2011 bottoming out
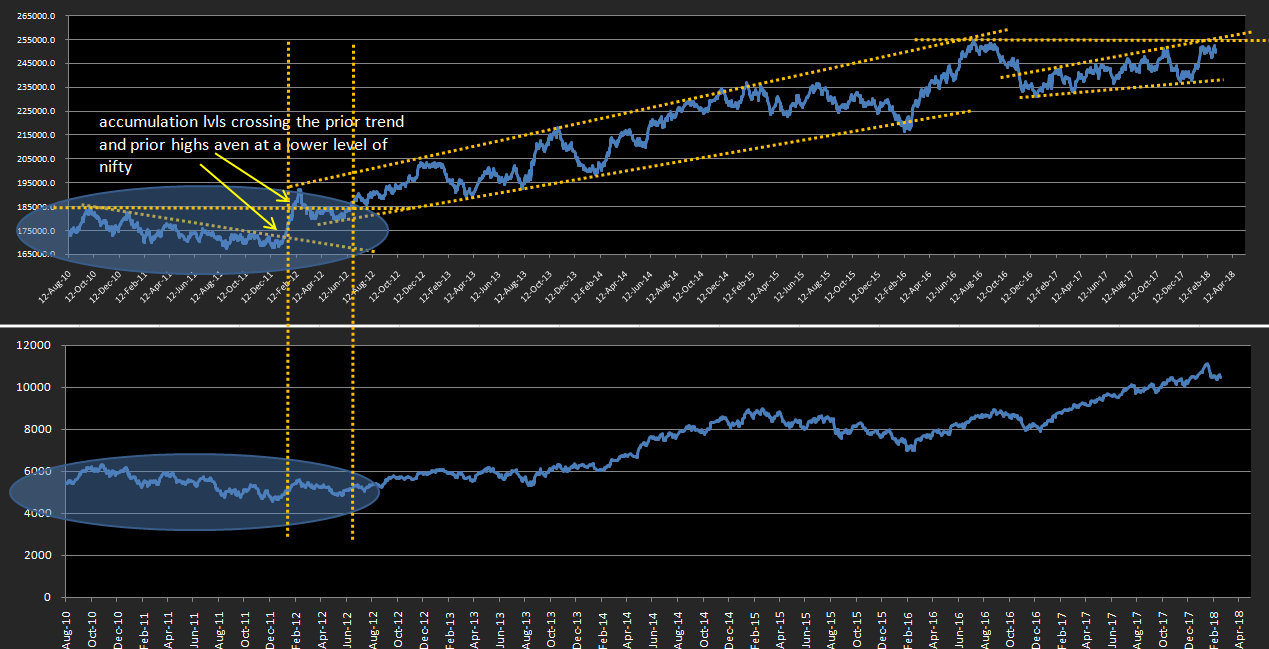
After reaching 6300 again in October 2010, nifty went into correction mode. The downward trend in accumulation levels was crossed in January 2011 and the rally started from there. And that rally is still going on strong
2016 top in accumulation levels
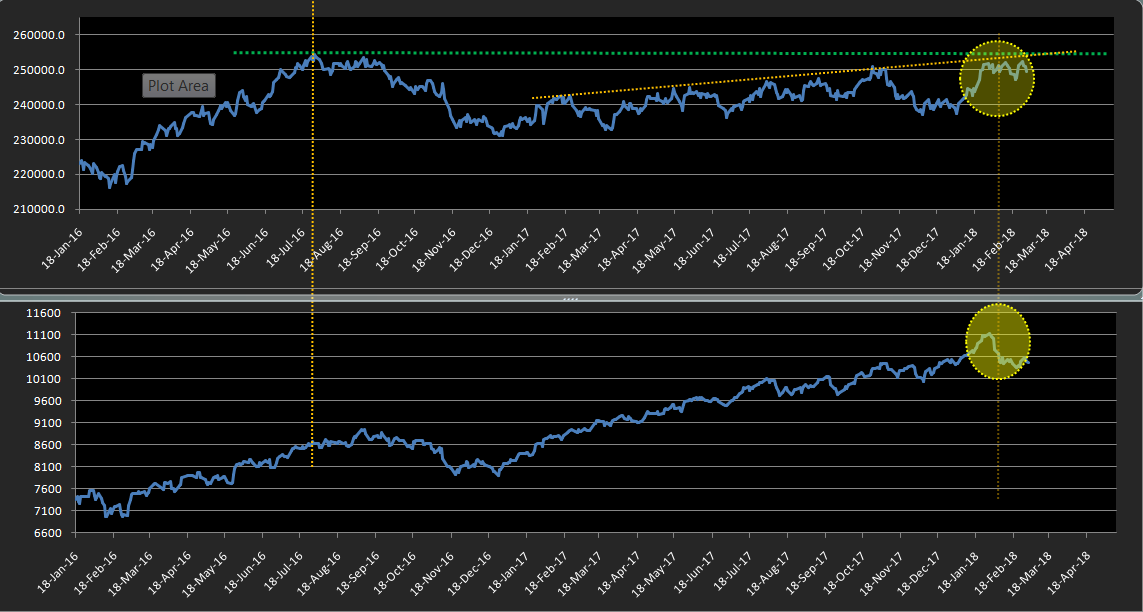
If we see things in this perspective a major concern will be that the present accumulation level is still below the high made in august 2016 when index was below 9000. Nifty rallied 2000 points but accumulation level has not reached the highs of august 2016. The distribution during the minor bear phase between 2016 september highs and the demonetization lows (a fall of 1100 pts), has not been covered in the current bull rally of 3200 pts. (demon low of 7900 to current high of 11100).
Even though the accumulation level has not reached the 2016 august highs still the markets were rallying with increase in accumulation levels.
Rally from demon lows
The rally from demonetization lows is seen with steady accumulation but still unable to surpass 2016 accumulation high levels
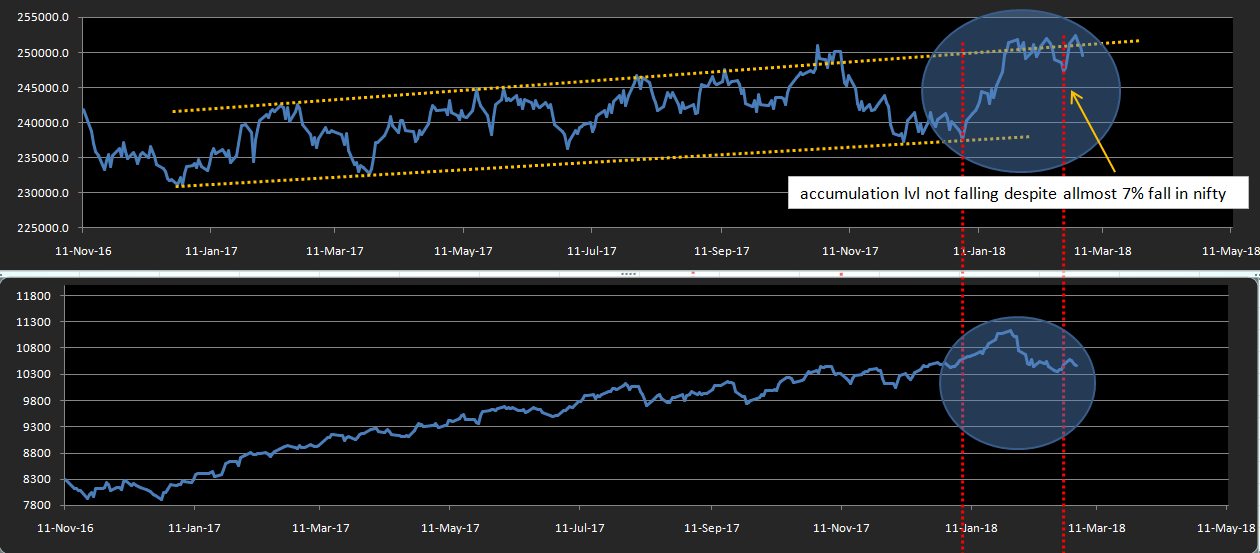
The current fall in markets
From the previous charts it can be seen that during the current fall of nearly 7%, the accumulation levels has not fallen significantly. Though this does not guarantee that we may not fall further, there is every possibility that the accumulation levels can breakout above the highs of 2016.
So I feel it is very important to watch the accumulation level at this point of time. Once the accumulation level crosses the 2016 high and make new highs, especially if it happens with index still below the all time highs, I feel it will be the starting point of the next bull rally which may be similar to the rally started in 2004.
It cannot be said that this may happen very soon as the present accumulation levels are very close to the 2016 highs or it may take more time also if the present correction continues. So what makes me more confident is days which nifty closing in red and still we got accumulation. More precisely gap down openings with close near day’s highs, whatever may be the color of nifty candle. By this type of markets the accumulation level will break the high of 2016 and nifty still maintaining the corrective mode. This type of market will flush out weak hands, which are still left in the markets. I feel markets will enter into the next zone only after strong hands accumulates sufficient quantity and flush out all the weak hands remaining in the markets.
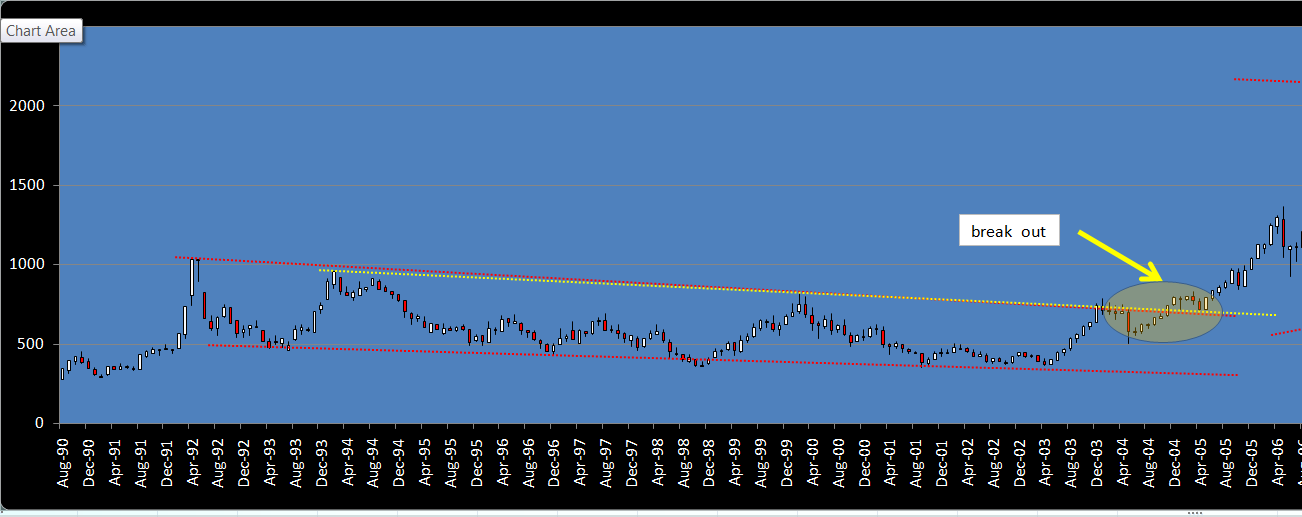
Also there is another break out happening or on the verge of break out is on the inflation adjusted Nifty which is similar to that occurred in 2003-2004
2003-04 breakout in inflation adj nifty
breakout or on the verge of breakout in 2018 ( only data till january entered)
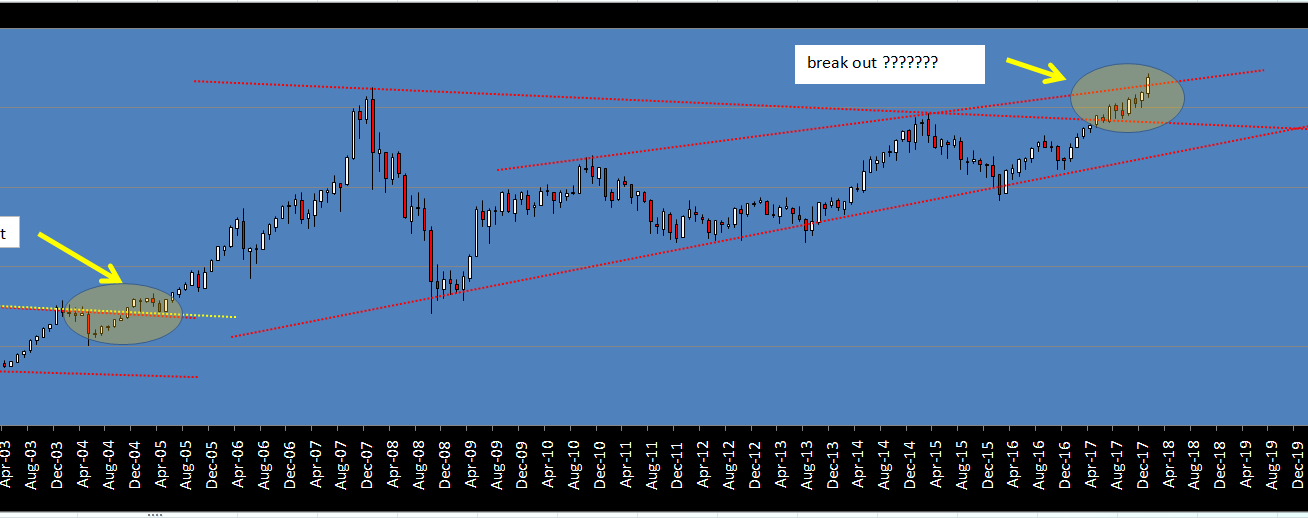
Discl: 80% invested 20% cash planing to deploy more if a clear breakout happens on accumulation charts.
10 Likes
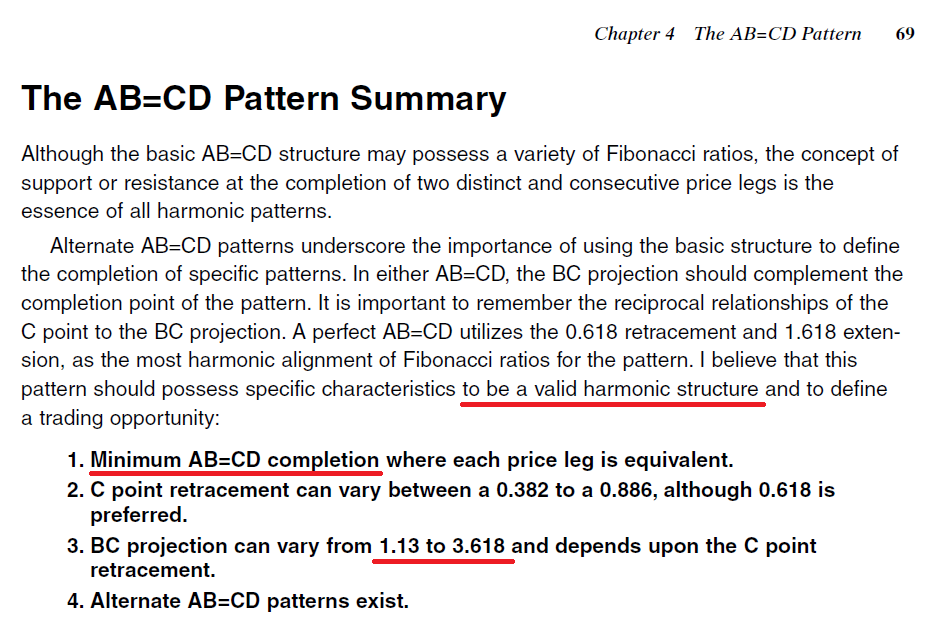
Here’s a snapshot from Harmonic Trading volume 1, page 69. Minimum requirement is completion of AB=CD (that’s why I think 1.27AB=CD and 1.618AB=CD are valid, but 0.618AB=CD and 0.382AB=CD are not valid). And another one is BC projection can be from 1.13 to 3.618. If you do anything less than AB=CD, then BC projection will be less than 1.
If these are not met, then it’s not a “valid” harmonic structure.
Contradicting things mentioned in two places. Which book are you referring to?
Fractal is a mathematical term. Fractal is an abstract object to describe and simulate at once for different objects occurring and bouncing at same time. Although fractals were derived from basic geometry it differs from it as the shape of fractals take different shapes as abstract expands or contracts. Confusing, right? And what is the relationship with stock market? I banged my head for 6 months to understand basics of fractals.
Markets are random, speculators try to find out patterns which can increase probability of more chaotic price movements. Basic fractals are used by consolidating more days (say an abstract) and establishing a relationship.
Example- use 5 price bars, when a highest high occur in the middle and two lower lows on both sides it indicates bearish turning point.
Bit advanced fractals is using multiple averages or multiple time frames. By using clustered time frames like a moving average, one can determine behaviour underlying fractal structure.
Fractals are to be created by individuals, customised not ready made. Once you understand logic it should help you creating own abstracts.
To understand usage of fractals we need to dive into chaos theory which itself is a big subject. To simplify in market terms, if the stock market is a fixed objective universe, then it may appear different in different situations and using different tools. Suppose if you use specs to see a sunny day it may appear shadow, if you remove specs it will become bright. Or you take picture of hand and X-ray of hand. They will look different. So, in reality how market appears to us has less to do with what is actually there than with how we perceive it. A particular paradigm through which we see market determines our feelings and behaviour.
For example, when a river flows, it’s not water which makes it fast or slow. Rather the underlying structure which makes it fast or slow. Say Ganga River in Himalayas is faster than Kashi. Reason is underlying rock to a flat surface river bed not the water itself.
Fractal is a geometry used to measure irregularity and perception. The measurement is done for underlying structure. An underlying structure can be created with parts, plan, source and purpose.
My logic behind multiple moving averages
Purpose of fractal- to know trend strength and characteristics. Individual moving average does not smoothen out turning point. For example, when 50 DMA crosses 200 DMA in hindsight it looks trend is changing downwards. At the day how do I know what investors
and traders are behaving?
Source: To use moving averages source is market data on different time frames.
Parts- individual moving averages to reflect short term and long-term behaviour e.g. 3 DMA to 60 DMA.
Plan- I am planning to use at the time of trend change, break downs and breakouts etc.
Look at Bodal Chemicals below:
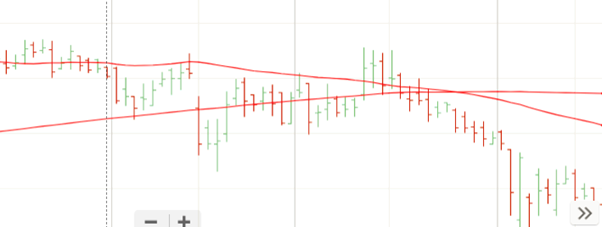
On the day 50DMA crosses through 200 DMA, look at closely support levels were yet to be broken can you say with conviction downtrend has started? You can check the date when 50DMA ripped through 200DMA i.e. 24 Jan 2018.
Let’s use multiple moving averages- a fractal
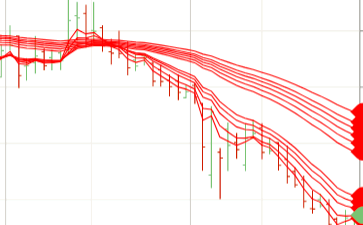
By 24 Jan what we can see is below:
Investors have joined traders in selling. Both investors and traders have started selling, you can see expansion in moving averages.
The gap has been widening between investors and traders showing trend strength is increasing.
You have to create your own fractals basis four structures mentioned above. Putting them on to chart is drawing or bit manual work. In this case I have plotted individual DMA’s on chart by selecting 3,5,8.10,12,15,30,35,40,45,50, 60.
Fractals is one of tool to link abstract to behaviour visually. Welcome to world of practical behavioural finance!
Caution- fractals or any other abstract (a combination of mathematics and behaviour) can be extremely confusing and counterproductive. As most of times we do not interpret properly which leads to consecutive losses. But fractals stimulate visual thinking and forms a habit to connect right side of brain. So, I keep doing one or two as experiment, far away from the main objective.
1 Like