
This seems like a perfect cup and handle to me. But then why is this post flagged by the community and is hidden?
AKSHAR CHEM (weekly chart)
The price has entered the PRZ, this will be the most interesting scrip to watch…
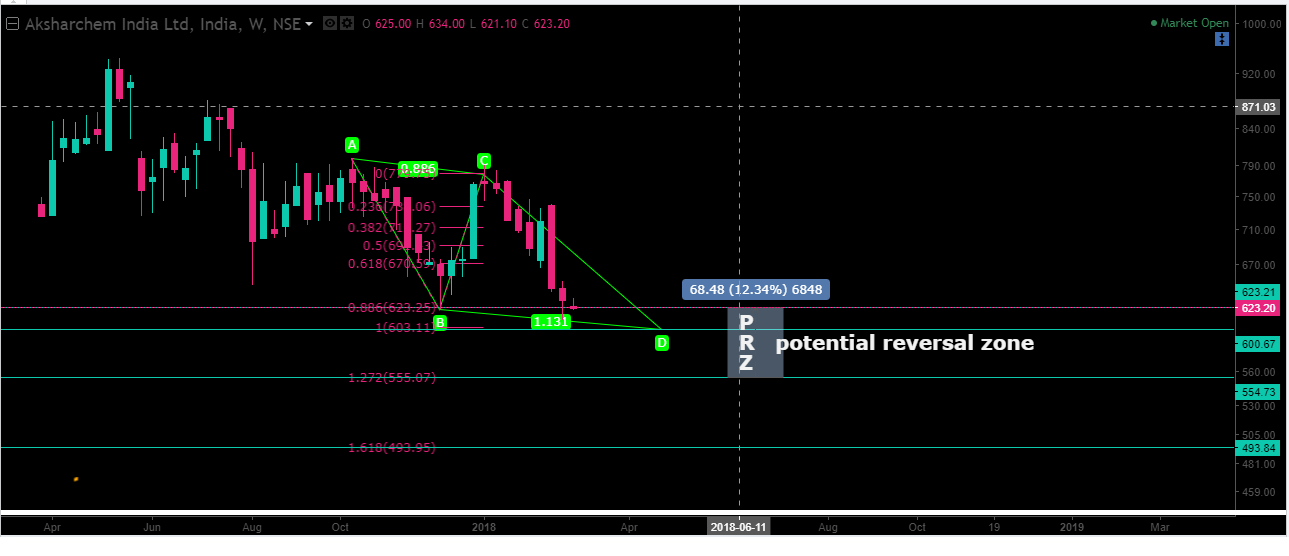
Disclaimer…Not invested, looking to bottom fish
Yiah a cup and handle by structure and momentum and classic volume changes, the depth of the cup is also under 33% , pattern to be observed…
Thanks!
Btw… Why flag it?! one of the best cup and handle i have seen…
No harmonics were possible with that low @PE_Ratio , i actually triend multiple combinations, wasten getting the structure or the ratios were failing…
Later found the present B and all the ratios did a perfect match…
If you can form a harmonic with the low point u are talking about with the highs and lows i have taken for the XA, please show … orelse if you can manage a abcd, that will also be fine…
We shouldn’t take a random low to form a pattern, right? That’s like forcing the pattern. Pattern should form naturally.
definitely, I am also reluctant to work this way, but the moment i took that B the prz resistance levels and other ratios started to fall in place…
Specially note the 1.618AB level resisted the price upmove like perfect ,so also the 2.24AB gave a support… So i was convinced about the B point…
But u are right i was not comfortable while drawing this…
Check this apple chart of the butterfly, the B point was not the ideal B, but it was forming an ideal bearish butterfly if that B was taken, so this is what i was talking about , there is a lack of standardization about the points XABCD , rather the ratios are standardized …
But as the ratios depends on the points, i come in a soup what to do… But so far, small variations didnt make much difference, as the prz remains the same…
But i want more opinion on this!
Thanks for the response, but no idea , why flag, I am new to this forum, may be made some mistake while posting.
1 Like
Keep up the good work… Learn some harmonics and also enrich this thread…
Anyone came across an alternate bat???
If so please post example
https://harmonictrader.com/harmonic-patterns/alternate-bat-pattern/
@Capsule91
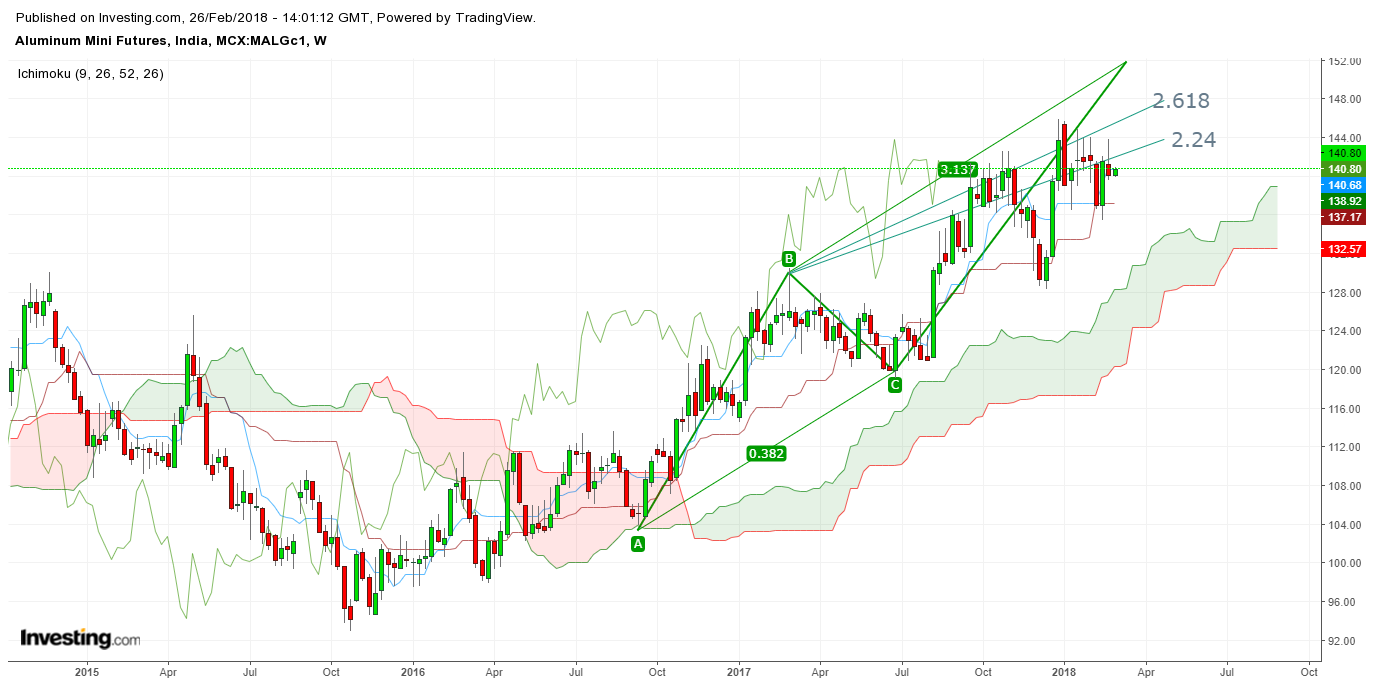
I have tried to analyze the trends of Aluminium Futures. This is a long term view.
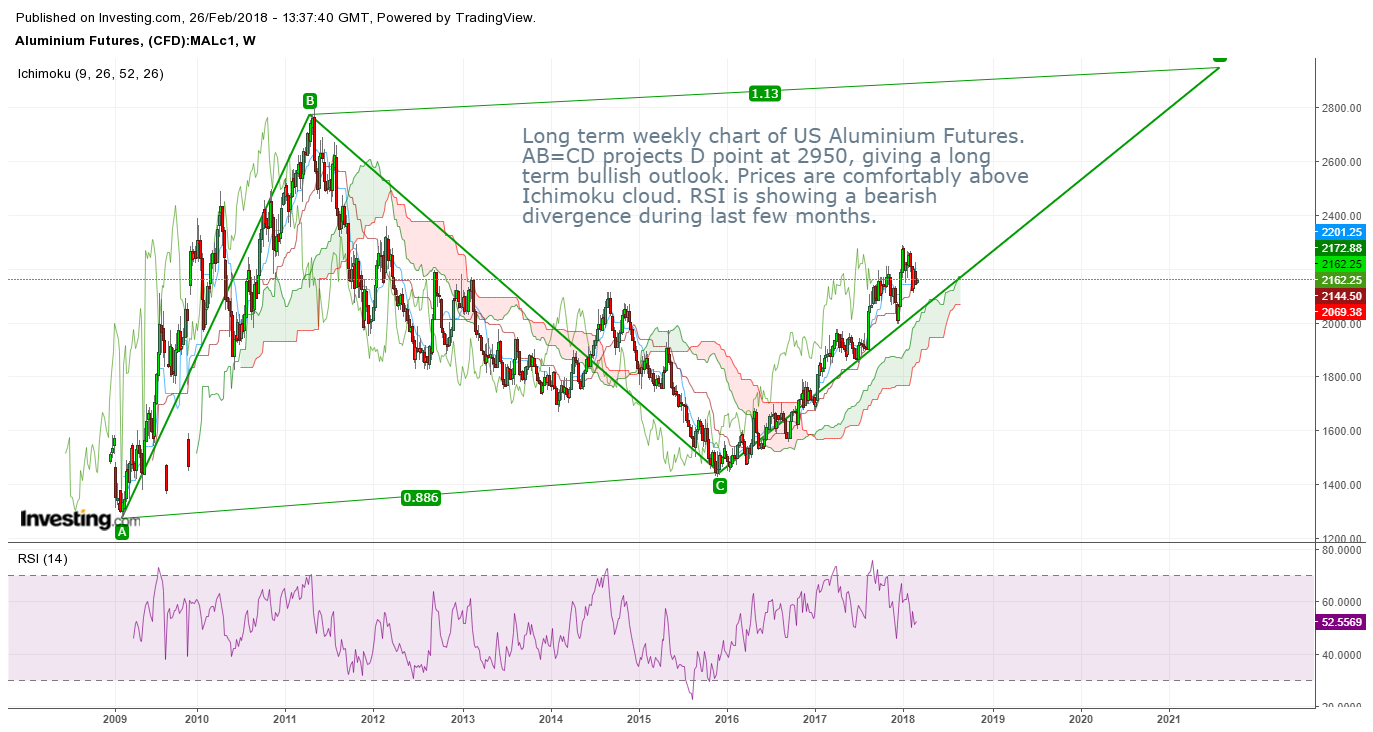
And this is my view of the weekly chart. A strong Bearish AB=CD pattern is complete. The most important point is that the retracement is sharp at 0.382, which is characterized by an extreme price action that we are seeing in the chart and the prices moved from 1860 at C to a high of nearly 2300.
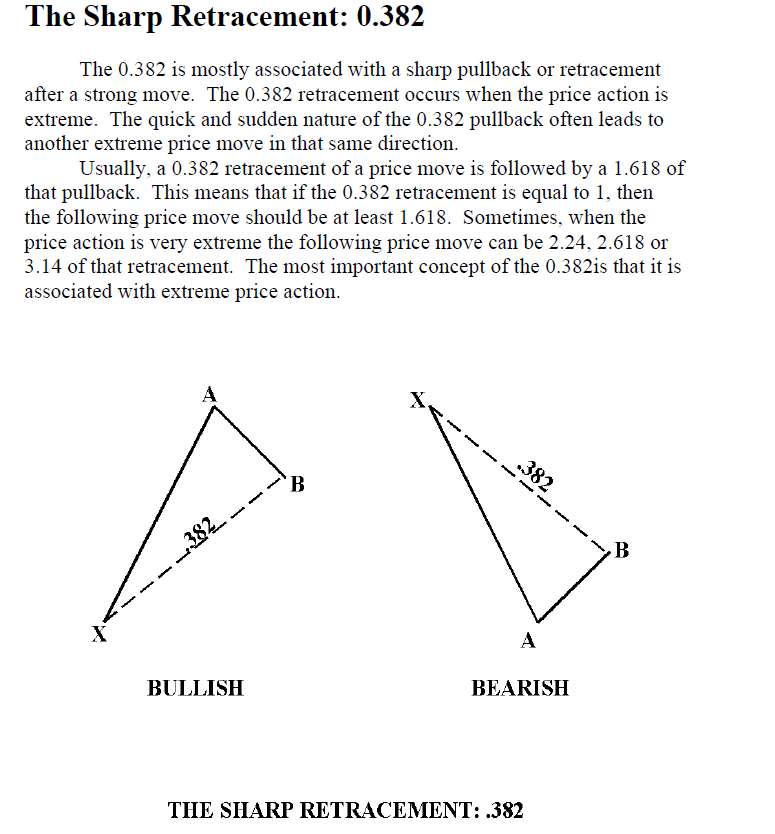
This is what Carney says about sharp 0.382 retracement
The prices are above the cloud, and to me the situations seems bullish.
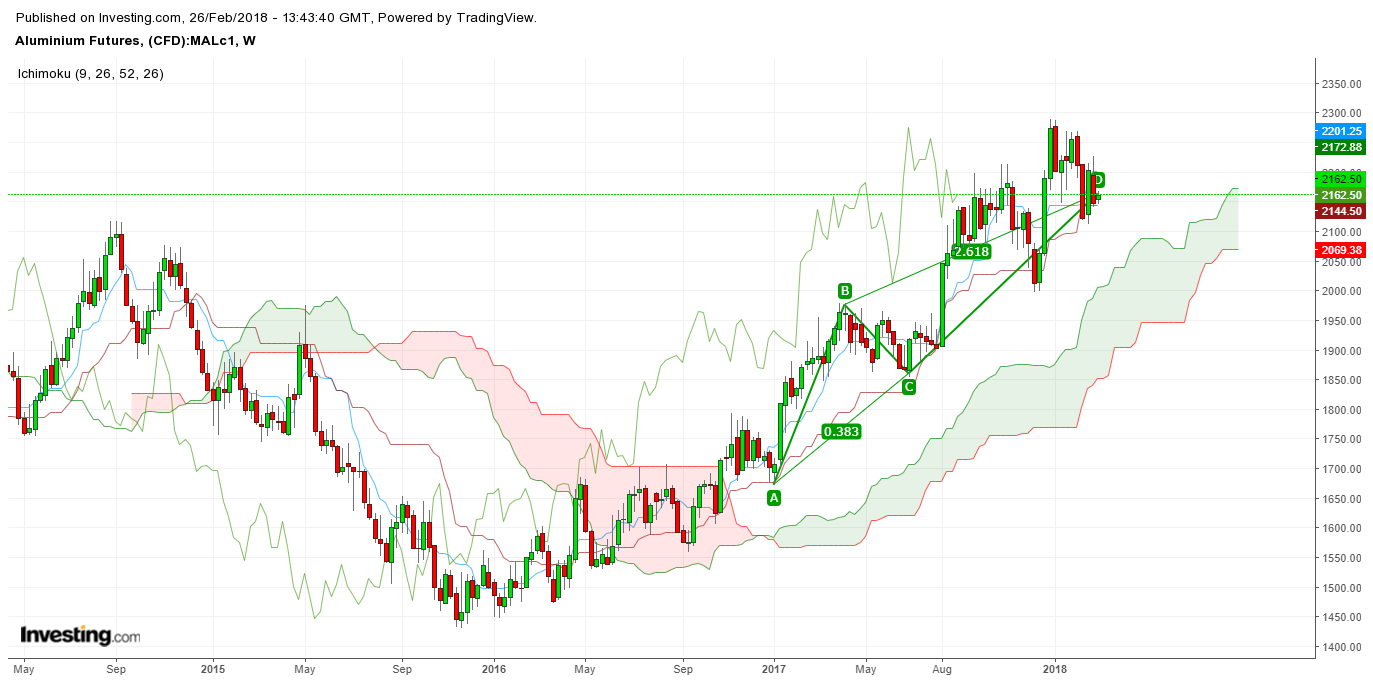
This is how MCX aluminium futures closely resemble US aluminium futures. After a sharp 0.382 retracement, the D point projection can be at 2.4, 2.612, or even at 3.14. Here also the prices are comfortably above the cloud.
1 Like
this is how, you and me with contrasting opinions make the market…!
This the beauty of it…
I agree with you analysis…
Lets see whos idea plays out, 0.382 , 0.886 and 1.618 are growing as my fav retracements…
1 Like
Just for demostration purpose…
The head and shoulder and AB=CD trade…
First the head and shoulder confirmation and retracements…
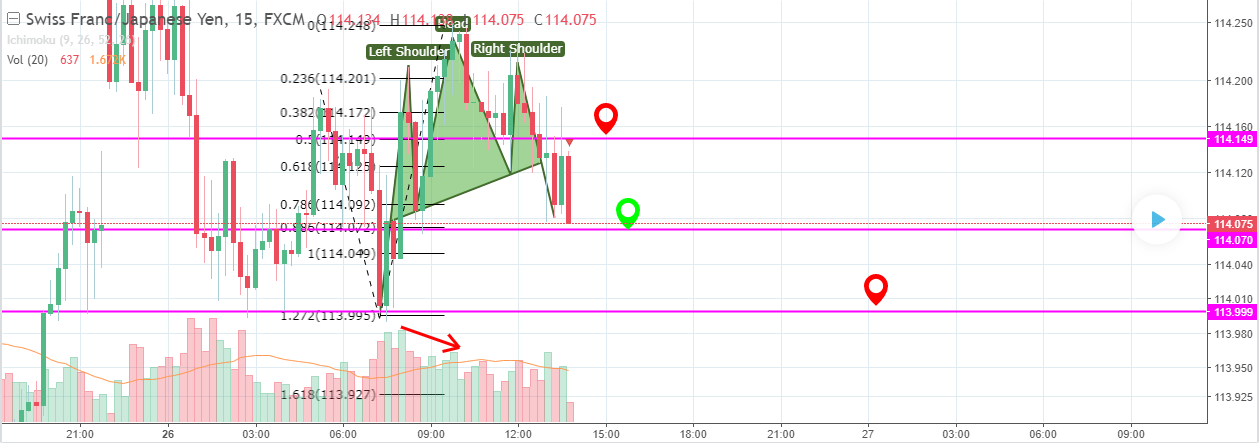
Then the Ab=CD
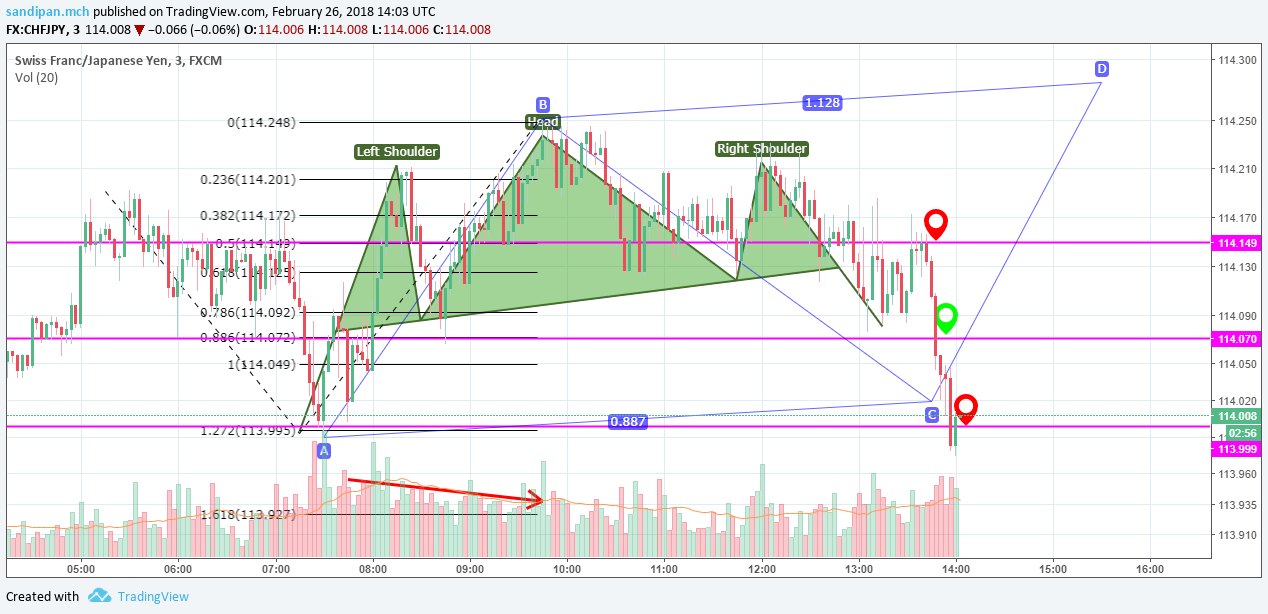
Full blown /Head and shoulder effect after trade
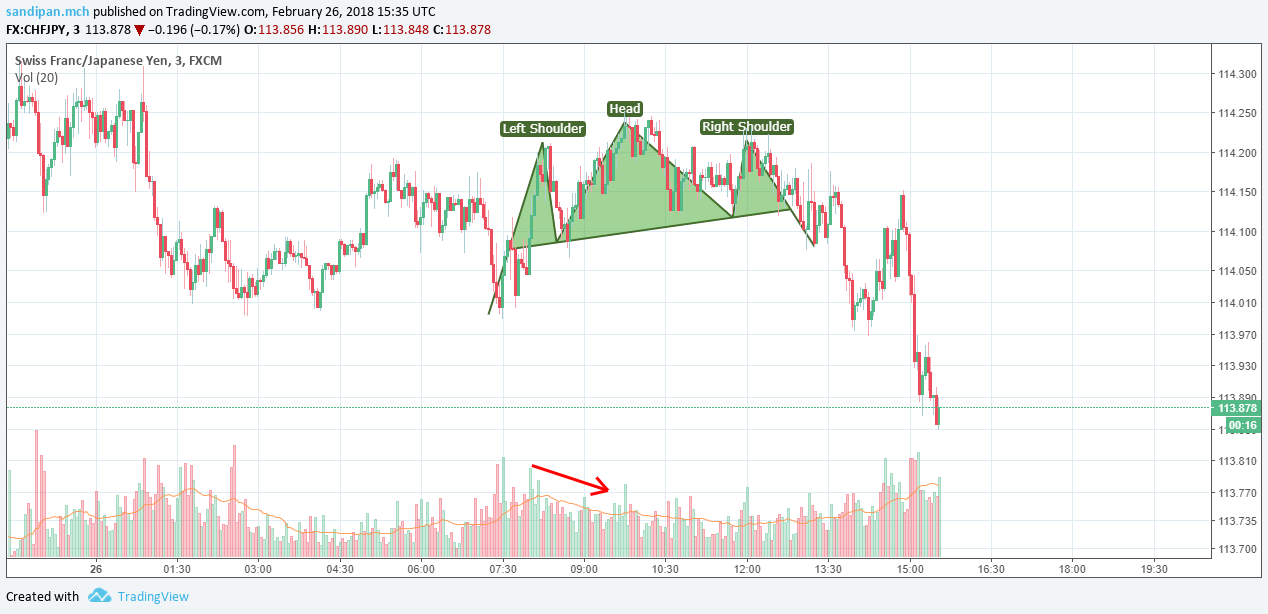
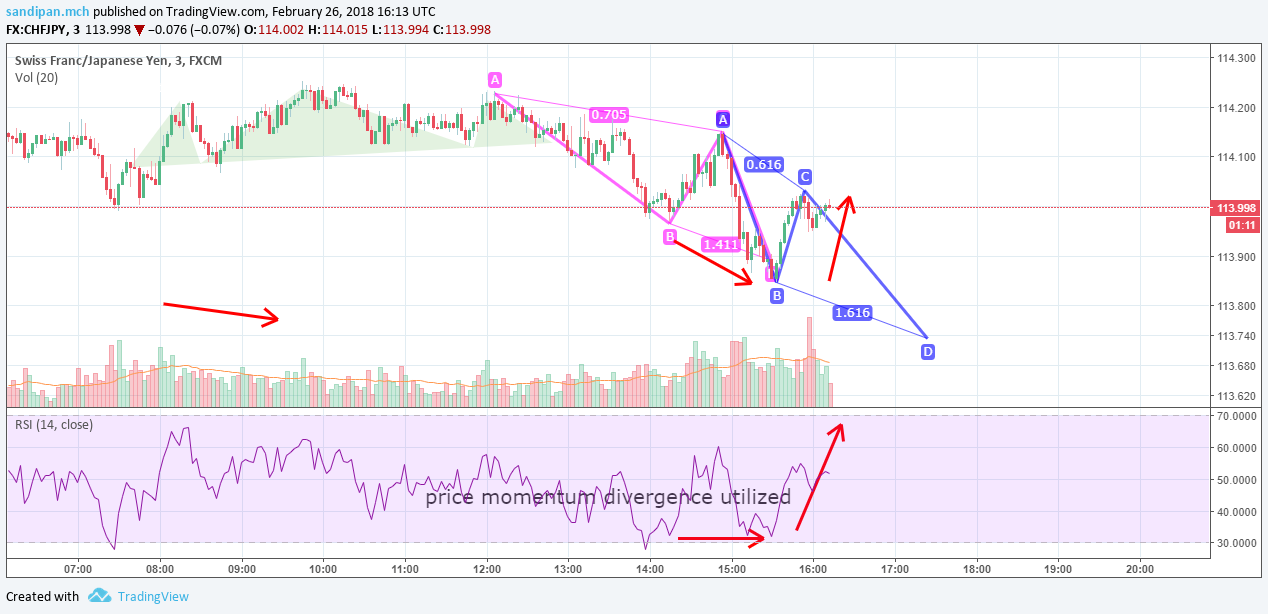
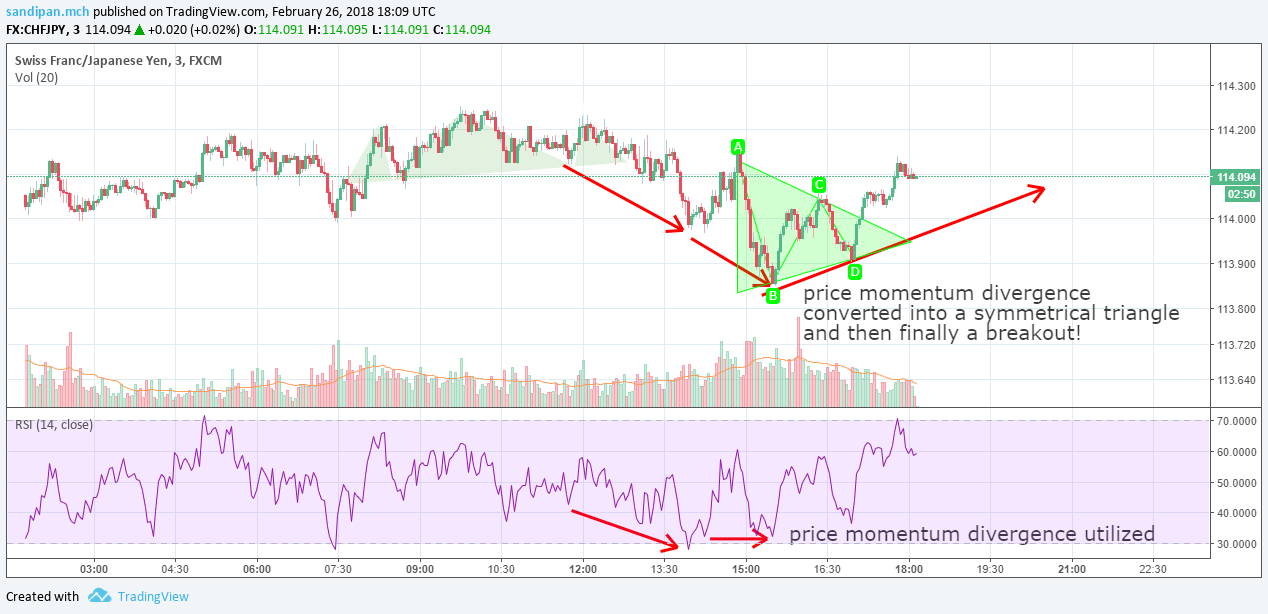
price momentum divergence confirming the (pink)bullish AB=CD
@Agarwala i guess we sud never underestimate the power of a primary fib ratio 0.618 over 0.382 which is a derived ratio
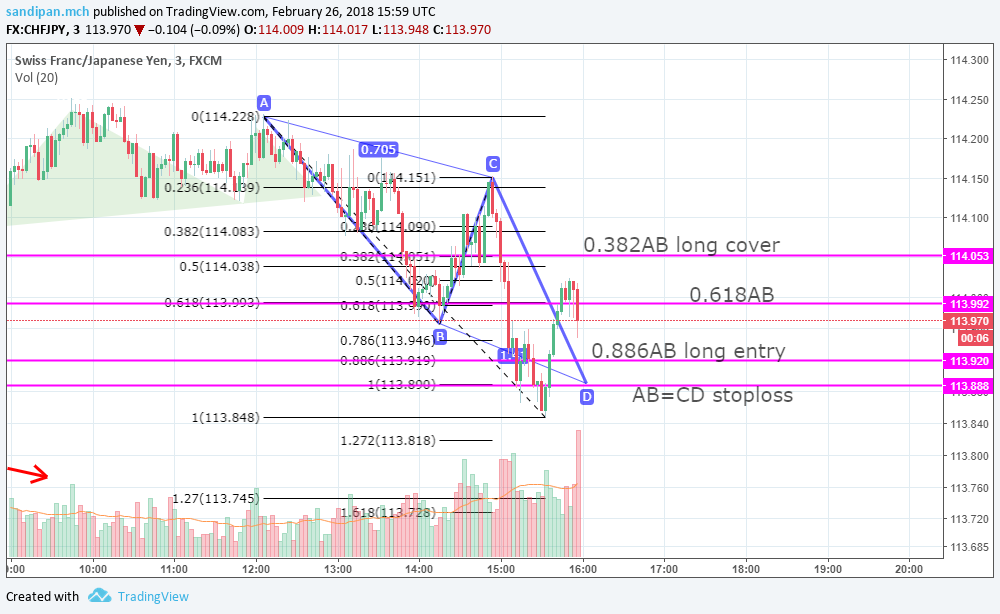
Swiss Franc/Jpy (3 min chart)
Head and shoulder followed by breakdown followed by divergence followed by symmetric triangle followed buy breakout!!
1 Like
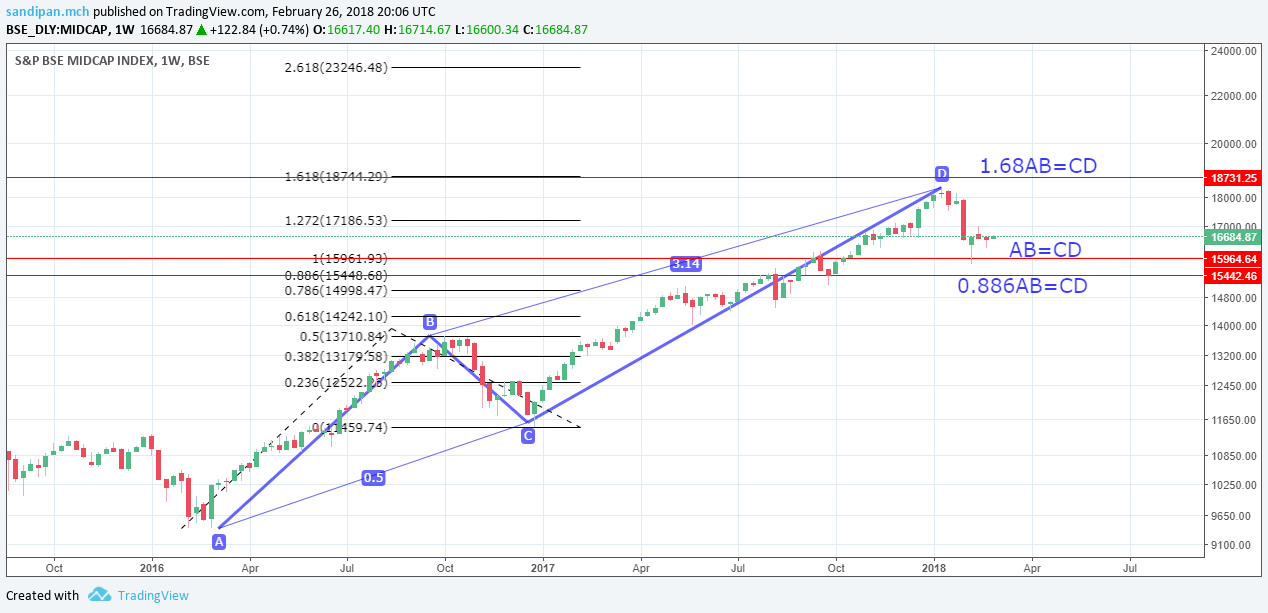
Midcaps were bound to face resistance in january…
Infact it was the holy grail number 3.14(pi) on the BC retracement of the alternate bearish abcd which threw the hammer
1 Like
check this out guys… chick on the forward button to see wht happened… we should practice gann fan an fib fans…
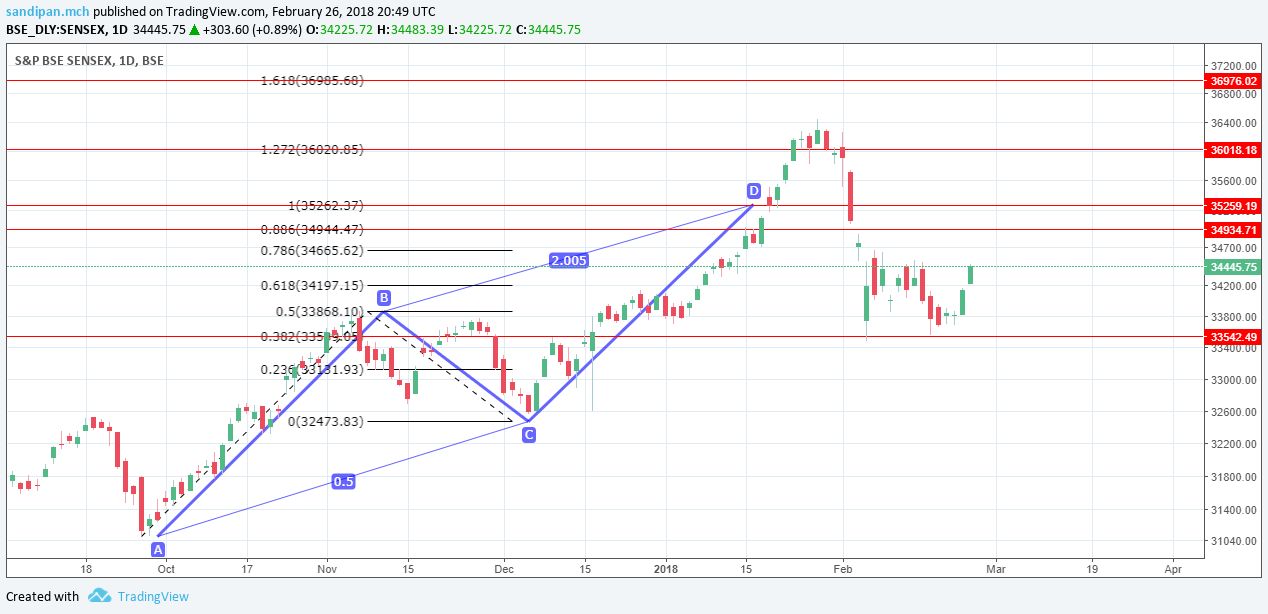
similarly anoher undeniable level id 3.14 pi level…
Chk the mid cap chart i posted a couple of post above
Yes @Capsule91 I can see resistance at 0.886AB=CD and AB=CD levels. Finally near 1.68AB=CD the index reversed. But the BC reversal is 0.5 and the CD projection with that you have taken as 3.14. With bookish view it should be 2. Although 3.14 has worked perfectly in your case, but I did not find any mention of that. Can you give me a hint. Also looking at daily chart with the same AB=CD pattern would be really interesting.
1 Like
ref to pg32, 33, 34 of vol1 for pi…
Bro can u help me out with Pokarna chart…
I see a descending triangle breaking out in the short term and longer term speculative trends, what i need help is find hidden patterns as the stock has been very volatile and in the daily chart in last couple of months a head and shoulder like pattern has formed but vol characters are not indicative…so also opine on that…
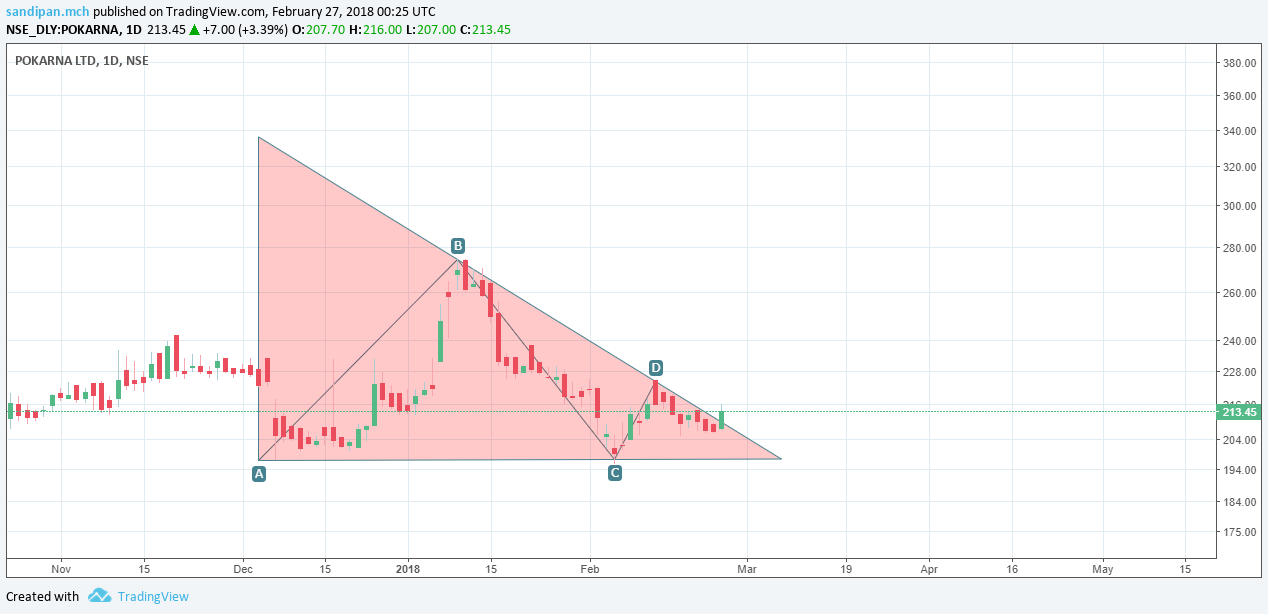

there was a triangle breakout in the weekly too later which the price got caught in the triangle in the daily, but i guess thats because of the prevailing head and shoulder pattern
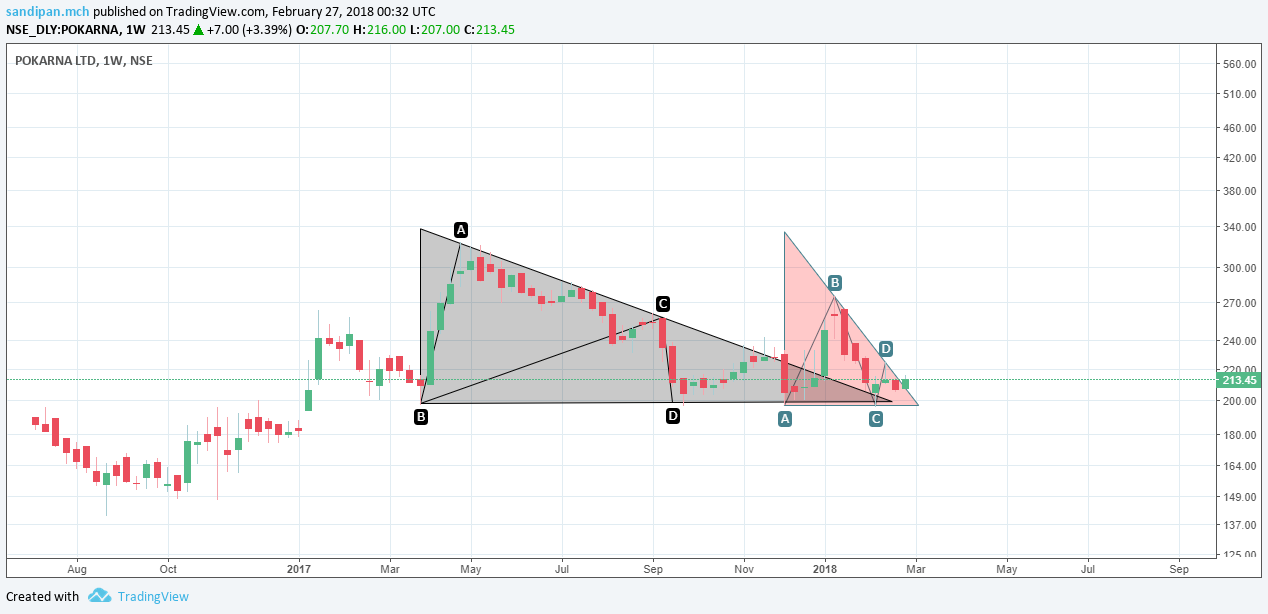
But u will see a very long term support has been maintained at around 200 price, for these bearish trend to happen, that has to break too,infact the triangles are been formed by this support level only, maing a descending triangle, will be interesting …
Disclaimer… Interested, looking for entry
@PE_Ratio, @Agarwala, @hitesh2710 sir, @The_Confused_Consult sir…
Please opine…
Fundamentally there are a lot of factors but important point is, they are having a stalled topline but maintaining margins(business dependent on crude), building their own brand name to possess pricing power, undergoing capex which will come online in about 1.5years and will increase topline by 130% at full capacity utilization, presently the demand growth is higher than supply flow over all, but they are a niche play with breton stone quartz technology, there supply growth is even lesser than general quartz…Debt to equity ratio is more than one, will reach around 2 after spending for capex which is a greenfield one…The management guides to maintain margins and since they are mainly export oriented, forex variations has an effect on topline and margins, as they cannot pass through to customers directly, same goes for risk from crude price hike…