I have mentioned Bullish Bat and not Bullish Gartley. Secondly taking a different B will not make much difference and PRZ remains the same.

Oh sorry my bad, read wrong…
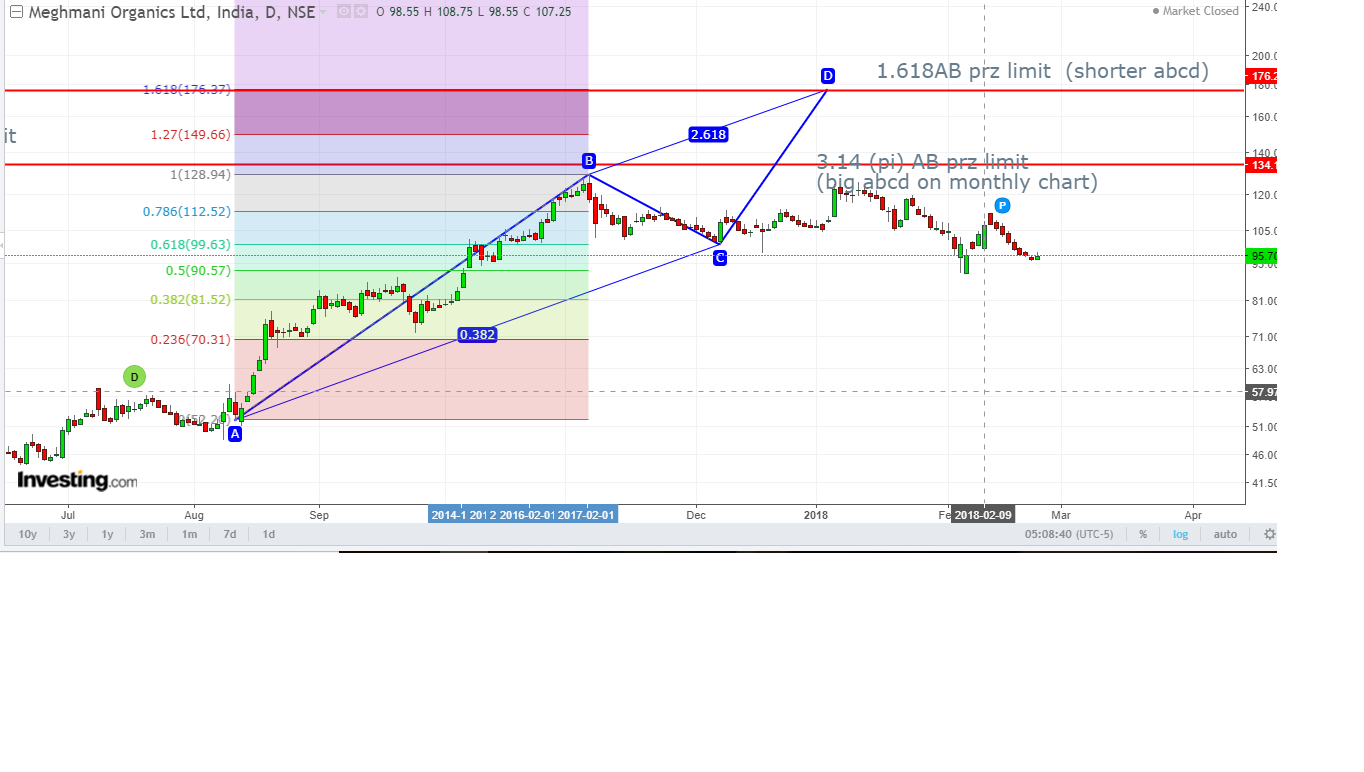
So a long term bearish abcd is being countered by a bullish bat…!
Here is something more that supports that prices can decline from current levels in the direction of a bullish bat.
AB = CD formation shows that the prices of Meghmani Organics are in potential reversal zone. Moreover the cloud is above the prices providing resistance.

1 Like
@Agarwala I respectfully disagree with you here. I don’t see that as ABCD pattern. From the points A, B, C you plotted, it must be Bearish ABCD, which means the point D must be above B. At D, you will sell. But your chart shows D below B and it’s sideways movement from C (I’d rather expect bullish move from C to D). If you replace A by X, B by A, and shift every point one step forwards, it’s forming bullish bat. I agree with that. But it can’t be a ABCD pattern. Or maybe I miss something. Could you explain please?
Yes @Agarwala is absolutely correct on retracements and this abcd is a complementary one…
But is not a valid abcd pattern…
He used the inverse of 0.382 as 0.24 and not 2.618 , if he used 2.618 he would have got the pattern you are talking about , so technically its correct to have a 0.24 retracement…
But the books strictly says it cannot be lower than 1.13…
So you are actually correct this is not a valid abcd pattern…
This would be the valid abcd bear, but the price action didnt follow this
@Agarwala , do you have a different stand?
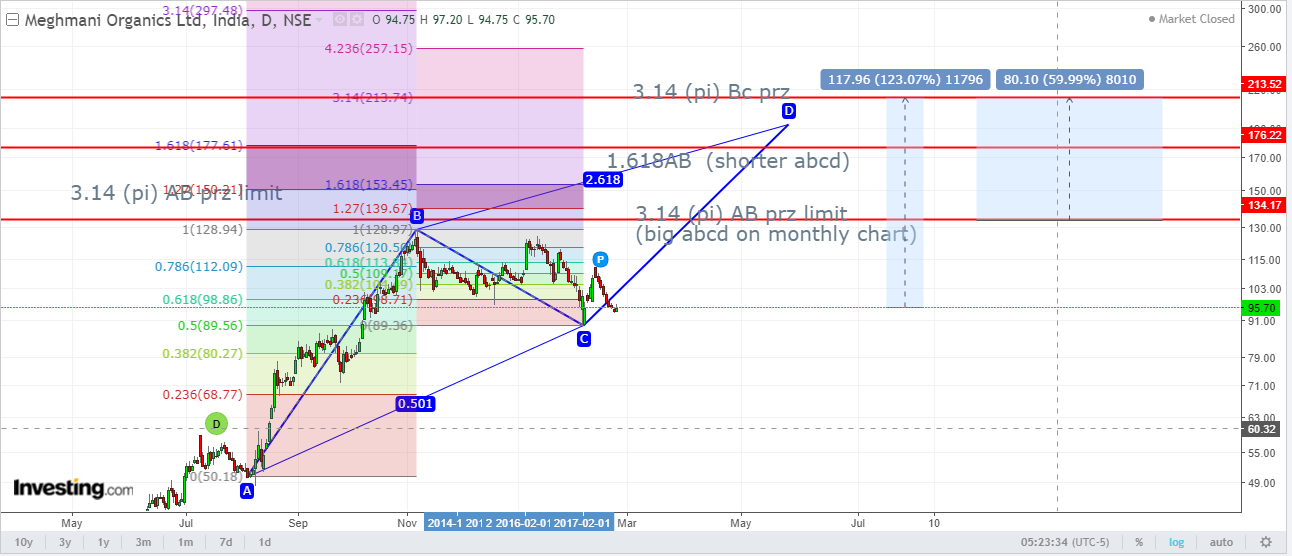
on a different note…I have serious doubt whether this bat will be a significant one… because the longer term bearish abcd formed a pi number prz and the prices got rejected from that…
But yes, this bat can also create a breakout required to break the pi pzr…
@Agarwala , do you have a different stand?
1 Like
Usually in a valid ABCD pattern, if BC retracement is less, then the CD leg will be a huge one. Here in @Agarwala Meghmani chart, BC retracement is 0.382. So I’d expect CD move to be something like 2pointsomething or 3pointsomething projection of BC. Not in the range of 0.24. If it had made a move like 2point or 3point something of BC, then it would have been a valid ABCD pattern.
Actually if meghmani breaks the longer term pi prz limit resistance with @Agarwala 's bat , a huge upmove is possible…
This is totally speculative but…
Another interesting thing to watch
GNFC
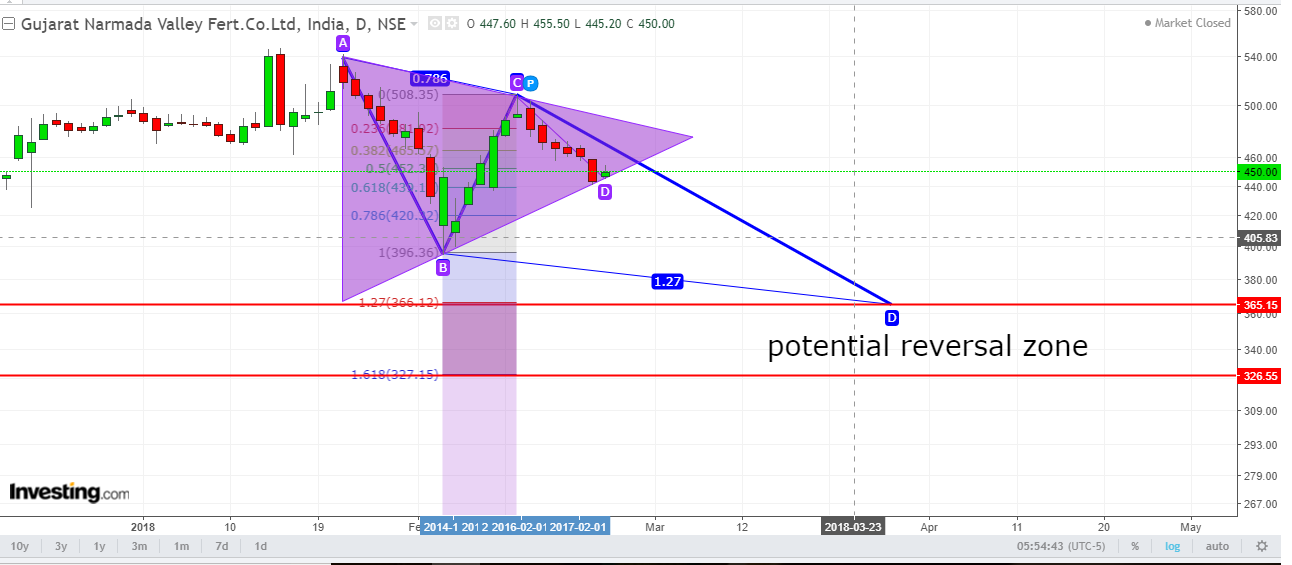
Symmetrical triangle vs bearish ABCD rendezvous
Disclaimer… invested
this is a nyc read
1 Like
have a look at scott carney’s youtube channel, the originator of formal harmonic trading
1 Like
@Capsule91 I am not familiar with 99% of patterns. I came to know about Cup and Handle due to my constant reading of Bill O Neil and his follower’s books and articles. I can share what I do. I use basic data as price, volume, time and build a story with fundamentals. I write it down how the story will unfold in coming days. Initially my story scripts were way off mark (still too I guess). But it has improved my process to some extent as time progresses and mistakes identified ongoing basis.
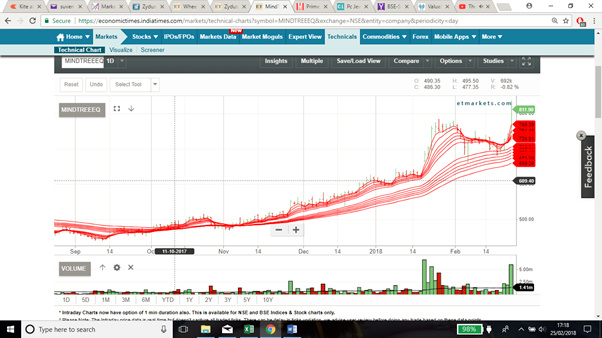
I am apologizing to disappoint on your expectation to start with. But what I could do today afternoon, sharing a new story just wrote on one of your example Mindtree. This is how I go about.
Coming back to your cup and handle, let me share with you something. I was fortunate to be present in IBD meet back in 2006 and 2011. Bill (William) O Neil was categorically clear, he is not trying to tell people to find a cup and handle. Rather to understand different crowd behaviour against a stock and why. For educational purpose and his 100 years of research created a visual thinking inside his brain which looked like a cup and handle to him. The same pattern looked like a ‘decelerating T’ to Mark Minervini. For David Ryan it was ‘Ants’. Please note both David and Mark are protege of Bill O Neil. Needless to say, Bill O Neil is a legend who swiftly use right brain. We may not be at that stage to use visual thinking like either S curve or Bell curve.
Bill O Neil realised for every stock to go up require to rest, get a momentum to move up and again rest before starting upwards. Every momentum will require major buyers (powerful crowd) to take it up. And if these powerful buyers hang on to their decision the stock will display a steady nature at base as it finds support from powerful buyer. Due to the timing of involvement of powerful buyer’s stock will rotate within less powerful buyers till the time again powerful buyers join in. Powerful buyers are big volume buyers i.e. he called them institutional buyers (I in CANSLIM). Post a powerful buying stock reduces its action i.e. both price and volume. It contracts due to retail involvement till it come to stage buyers and sellers disengaged from stock and move somewhere else till powerful buyers comes in again. So, all handles should form in upper part of base, better if does not slant too much (either upward or downward). If it slants too much it means daily fluctuations in price range is high and not contracting.
Now imagine which company will attract large buyers for long time? The growing companies which throws up surprises i.e. acceleration in earnings, revenue or margin. Can we apply this to turn around company? Yes, only after company is stabilised. Initially it may be parabolic movement started with sudden euphoria.
Now, shapes are in eyes of beholder. Even if there is nothing still we can create a visual impression anywhere. A trend can look up in 3 months chart, same will look down in 1year. My suggestion is two aspects a. triangulate further data for underlying structure. b. identify crowd behind structure.
Fair enough, my views on Mindtree:
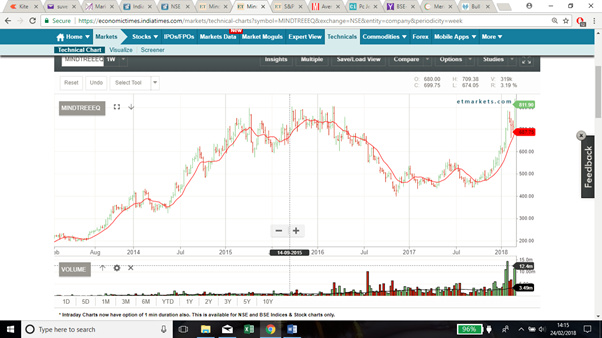
Primary trend: Stage 2 (Base Count 1 forming)
After stage 4 ended in month of Nov 2016, stock started consolidating (Stage 1) before forming new base and stage from Sep 2017. Good news, beginning of an uptrend. Do note how 10WMA (equivalent of 50DMA) is unbroken since Sep 17. And the green bars within base. This shows strong accumulation and positive sentiment. Lots of institution use 50DMA for support, reason is a 50DMA is historical pattern of short term mean reversion.
Now current situation:
See the base, starting from 18 Jan 2018. Stock corrected from 784 tops to 683 forming first contraction i.e. 13%. Second contraction 750 to 687 i.e. 8%. Along with price contraction volume contracted from 5/6 million a day to 1 million, before a very thin volume on 20 Feb- 480K! Stock zoomed next day with 5 times more volume and continued till now with additional buying. Can this be a cup and handle for pattern? Rather it’s a saucer pattern without handle (no contraction in end, as handle formed above pivot).
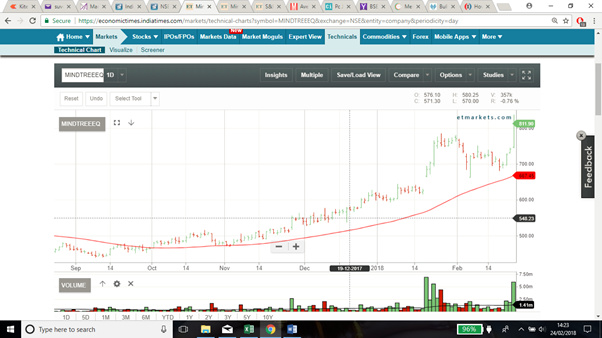
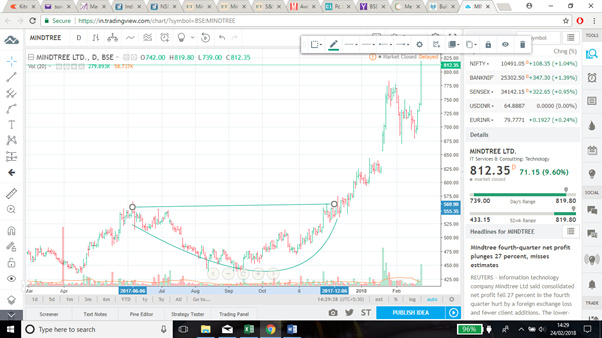
Pivot was around 565, that was the point it could have been bought for a high reward trade. Alternatively, second buy point would be 765 plus for current contraction around 50DMA. Of course, this does not include pullback entries. But coming out of a 4-week base with two contraction I would be hesitant to take fresh entry.
Can I triangulate with both S curve (fundamentals here as we have used technical as first variable) and Bell Curve (crowd participants)? Let us give it a shot with two key parameters (though I would like to include few more parameters like competitive advantage, ROE etc. I guess we are not getting too fundamentally here).
EPS Acceleration in last six quarters- -40%, -32%, -38%, -2%, 32%, 41%
Sales acceleration in same period- 11%, 7%, 0%, -3%, 3%, 6%
If we see EPS what a comeback, from a de-growth which touched -40% six quarters back now running at reverse positive number i.e. 41%. This bottom line is not emanating from organic revenue expansion. Expect one quarter revenue is flat for last five quarters.
Obviously, it’s not crystal clear from gunshot. But hang on, there has been increase in fund houses in from 24 to 25, but importantly shares held by them has gone up by 22% plus. Almost 90 lacs shares have been added by funds recently.
So, institutions are buying, why? I would love to know whether this trading activity or investing activity. I use one type of fractal for this, Multiple Moving Averages (a spread set of moving averages – for more go through Daryl Guppy basic concept of GMMA and customise).
Investors has been steadily buying since Dec 17, and confidence can be seen as long term moving averages has expanded big time towards middle of Jan 18. Even if traders started selling around Feb 1st week they couldn’t dent confidence of investors who consistently supported the trend. We can see traders rebound last week without penetrating investors (applying more pressure). The gap between long term and short term is steady, this shows good trend strength.
In a nut shell trend strength is good and supported by investors. And we have triangulation from that institution are buying. Meaning can be lots of positive news fundamentally. I am not tracking this stock. But it can be for example:
|-|Changing landscape in business and competitive advantage of company|
|-|Support from industry group |
|-|Management efficiency|
Now if we can build a story on both curves we know what we are expecting from a stock in future. Same contraction, sellers selling supported by additional buyers forming bases so on as we discussed above.
Note: If we see Mindtree we can notice a lots of accumulation on right side of chart i.e. recently. From swing trading perspective this deserve attention (could have been better close to pivot). For position trading I would still do another day or two day’s work to find out more behind this accumulation story.
8 Likes
@PE_Ratio
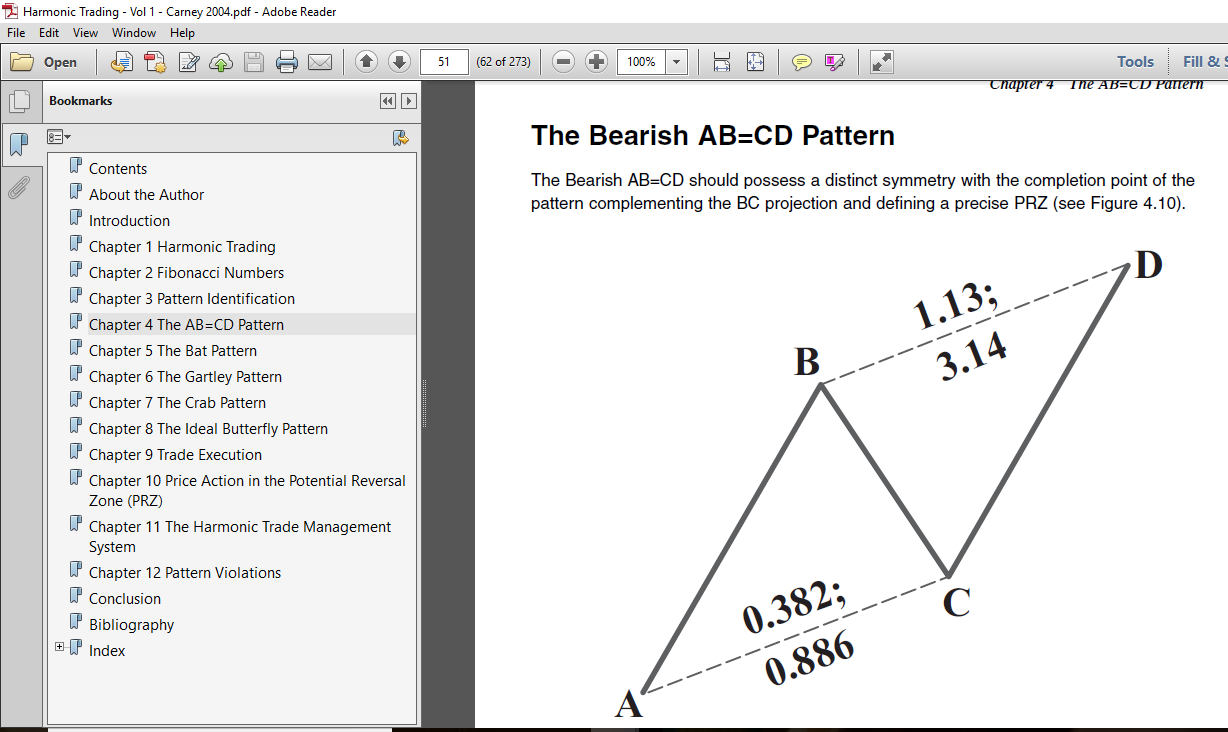
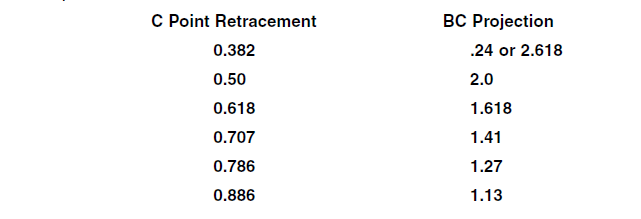
It is clearly mentioned by Carney (page 41, Volume 1 of The Harmonic Trading) that BC projection for 0.382 retracement could be either 0.24 or 2.618. In our situation since 2.618 does not appear to be possible, I have taken 0.24 as BC projection. I hope that this settles the matter.
@Agarwala Thanks for citing the source. The same page also mentions
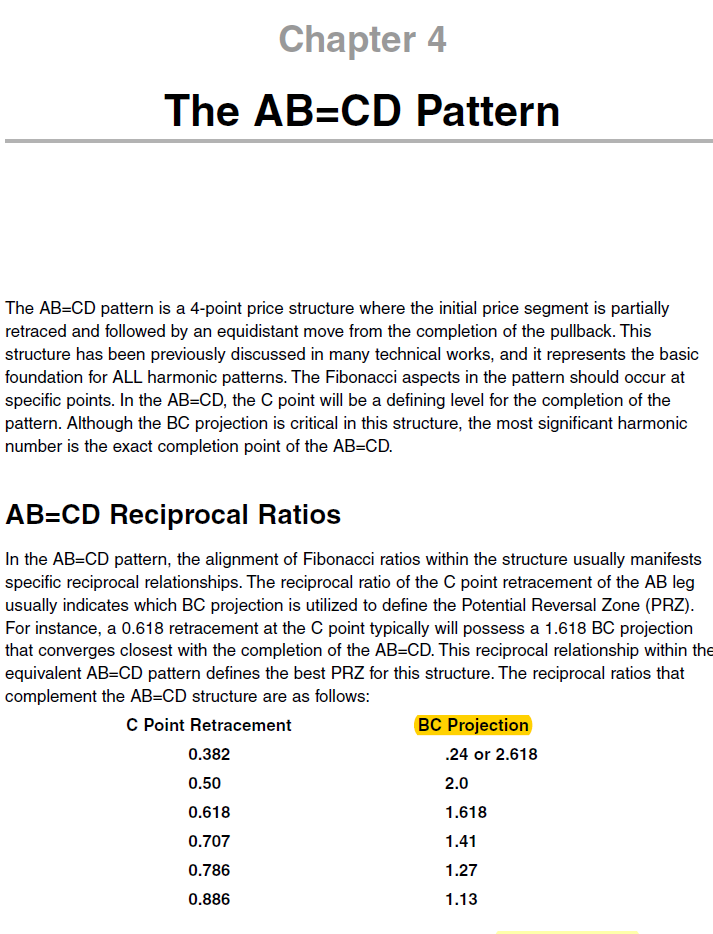
However, the most important consideration to remember is that the BC projection should converge closely with the completion of the AB=CD.
So, if AB=CD has to be true, then the D line should have moved upwards in case of bearish ABCD, and downwards in case of bullish ABCD pattern.
And the next page says that
Therefore, the C point can be 0.382, 0.50, 0.618, 0.707, 0.786, or 0.886. Referring to the reciprocal ratios listed on the previous page, this correlates into a BC projection that can either be a 1.13, 1.27, 1.41, 1.618, 2.0, 2.24, or 2.618. In some rare cases, a 3.14 projection can be utilized.
So it’s confusing.
I’d rather go with the reciprocal ratios for BC projection since Carney hasn’t explained the 0.24 ratio for 0.382 C point retracement anywhere. Do you have any example that uses 0.24 BC projection anywhere? That would help clarify.
the minimum bc projection for abcd is 1.13 and max 3.14 and that is valid for all harmonics…
chk pg 51 and i also mentioned this in previous post…
You are correct about the retracement possibility, but is not applicable for acbd pattern or any harmonics based on that…
@The_Confused_Consult sir, its too heavy for a amateur like me to enguf in a single go…!
I have to give it multiple readings about what you said, but i am completely sold by the approach you made in this post…!
I guess linking the fundamentals with the technicals is not an easy task, and i am presently learning the two separately…
Thank you for this post… loved it, didnt understand many parts, but will read more times and will get back to questioning you…
Just as a foot note… you stand out as a member in this advanced family of valuepicker…Please continue enriching us…
@Capsule91 and @PE_Ratio
The problem is that AB=CD does not mean AB is equal to CD. AB=CD is just the name of the pattern. At least this is how I understand it.
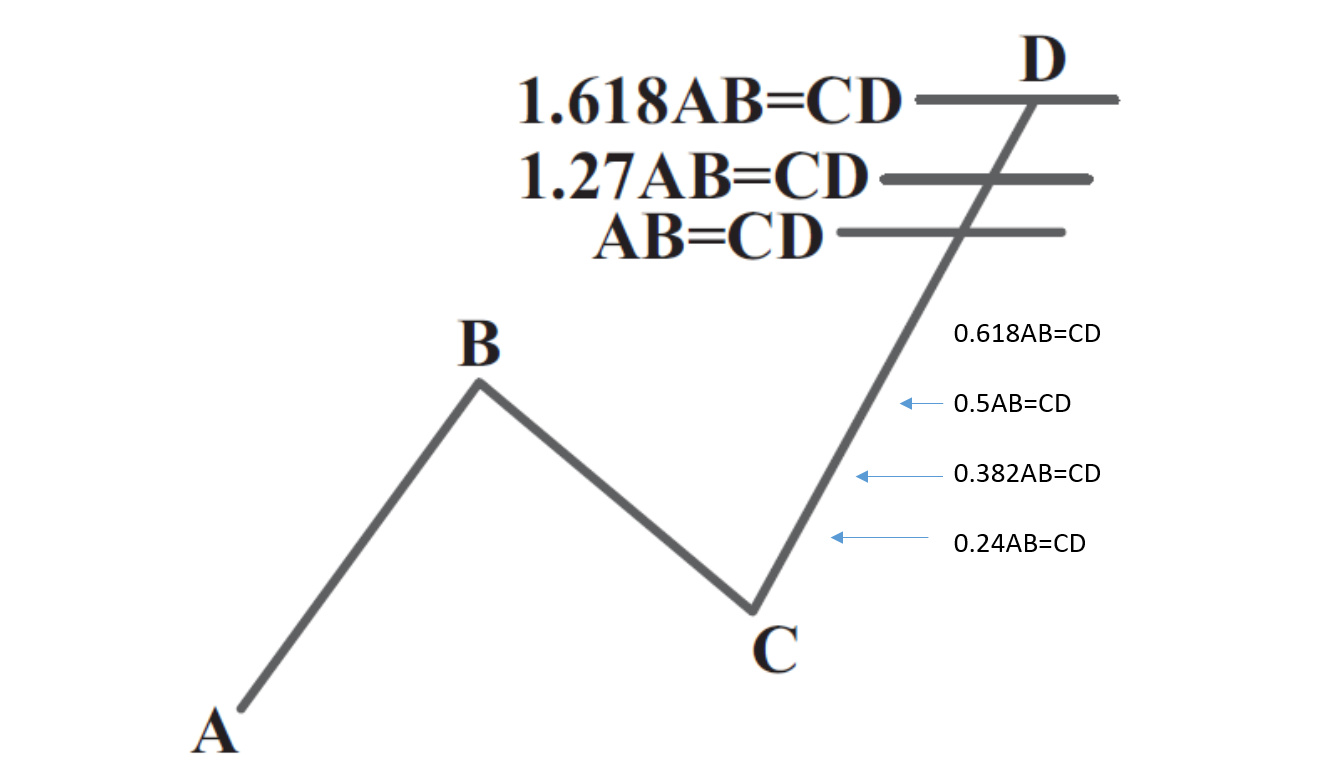
Carney initiates his discussion with the table that I have posted. I will repost that here. So it is not justifiable to say that Carney is not talking about AB=CD patterns, when he is giving the possibility of 0.24 projection.
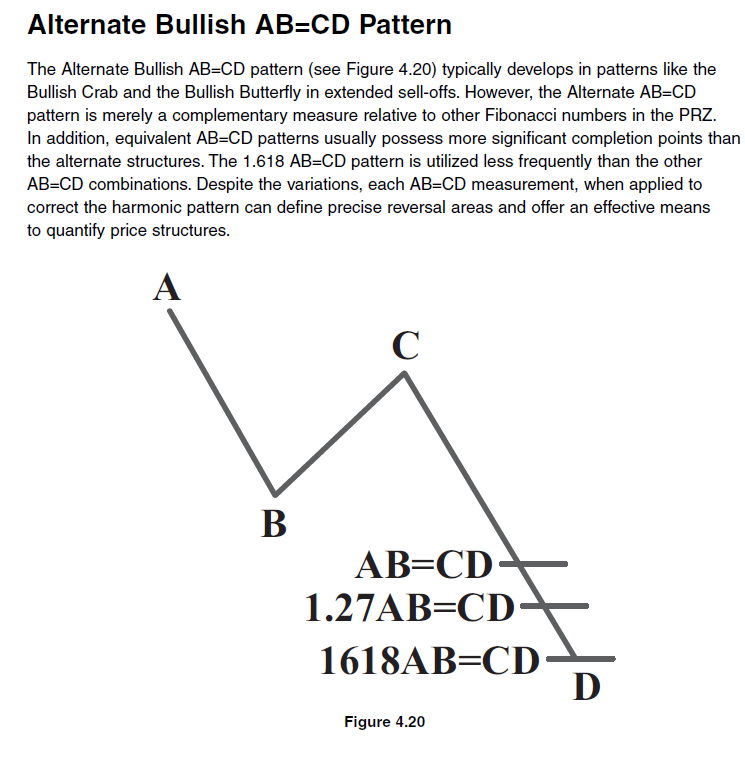
Look at alternate possibilities where AB is not equal to CD
Possibly we have to allow for a possibility of 0.24 retracement in Meghmani Organics. The PRZ suggested by 0.24 retracement in our case is holding for nearly two months now. So it becomes an example by itself. I am in favor of applying a more flexible and logical rather than a bookish approach in such matters. Carney gives out the possibility of extreme projections, along with normal projections. But we have a case of less than normal projections in Meghmani organics.
i read all this, but have not read 0.24AB=CD in alternate patterns and he mentions the 0.24 i see, but he also tells BC projection should converge closely with the completion of the AB=CD, which will never happen in remote possibility if CD goes diverging from Ab with 0.24 tracing…
Anyways, may be the author missed this possibility or is too rare to discuss, do keep it market if you see any texts mentioning this please enrich my innocence…
May be meghmani is not following the ABCD pattern at all here, its not necessary for the price to follow this all the time…
@Agarwala if you break up the abc and bcd patterns separately, in reference to pg 18 to 34, 0.382 is a Secondary Derived Bearish Retracement as in abc but no where its given as 0.24 as a bullish or bearish retracement while 2.618 is…so the retracement of bcd u drew is not a valid retracement of significance…
Anyways you theory with the bat is perfect and should form one by the price going down initially
You have done a great work all along, keep it up…!
@Capsule91
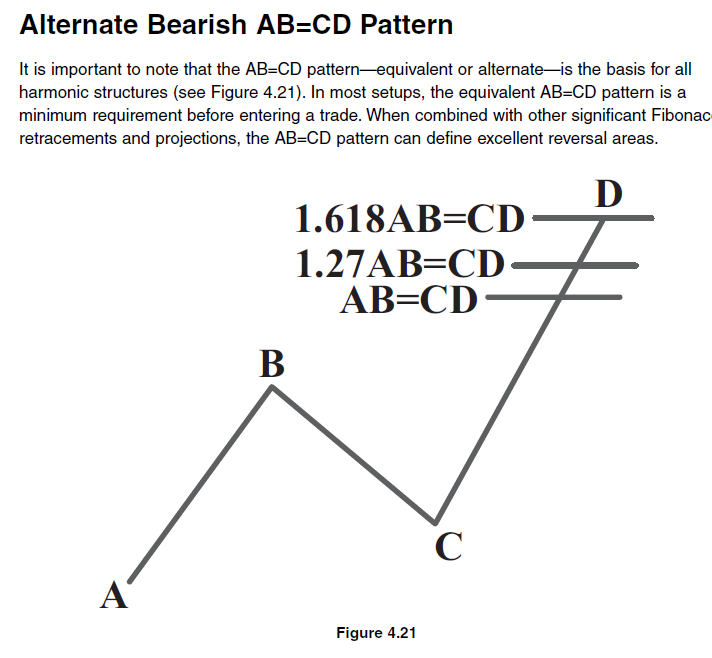
My submission is that patterns with CD less than AB exist. Also you can see many such examples in the charts, if you start looking for such examples. This is pure common sense man. Please look at the figure below.
The reason why these patterns are not discussed is simple. Because these pattern are not interesting to the trading community and to the Gurus who teach us how to make money. To my mind it is as simple as that. I am hopeful that you will understand my point and our journey towards becoming better technicians would continue.
1 Like
I am not at all disregarding the possibility @Agarwala , read i constantly wrote about it that u are correct in that sense…
But with author’s description of all the patterns, i didnt see it yet as a mention when abc or bcd retracement with 0.24 … 0.5 and 0.382 has been mentioned …
anyways, lets stop obsessing about this, its too minor…
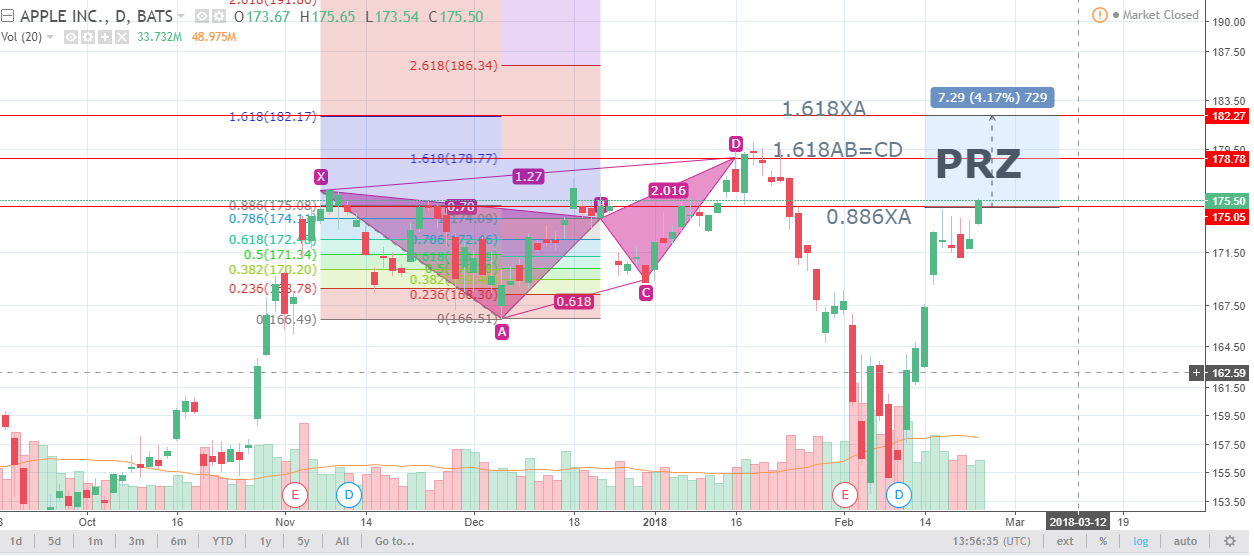
Look in the next post i found a apple inc chart describing classic butterfly with 1.618ab=cd pattern…
And why will our discussion not continue, the moment we started discussing here we have agreed to disagree…
1 Like