@Capsule91
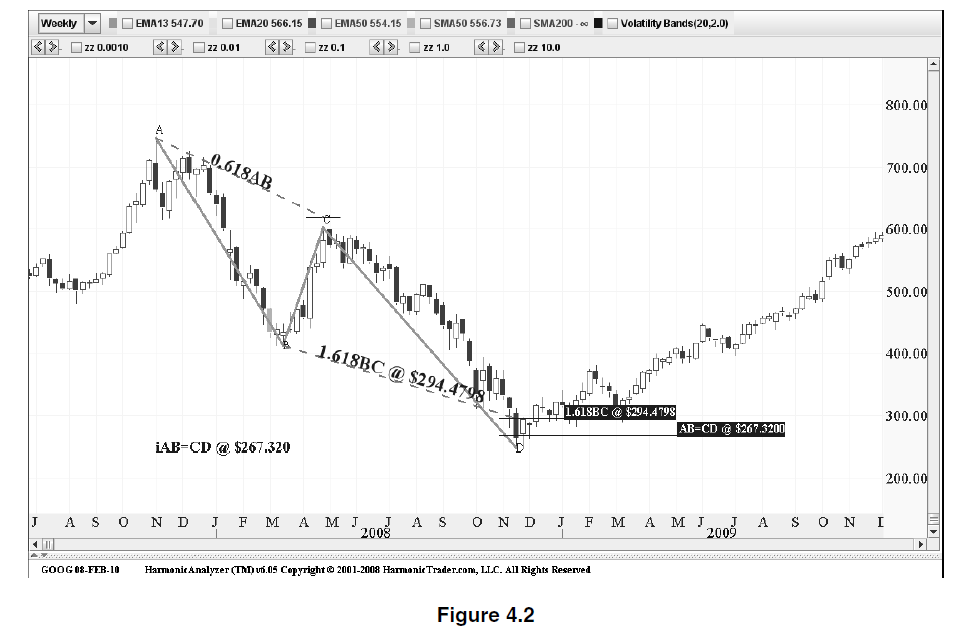
Please tone down a bit. You just have to look at the chart below reproduced from Carney’s Harmonic Trading Volume 1, Page 43. I am sure your doubts will be over about the strictness of Fibonacci retracements in ABCD patterns. In this figure C point is much below 0.816 retracement target, and yet it has been used by Carney for formation of ABCD structure. My advice to you would be that you need not be so strict in making harmonic patterns.
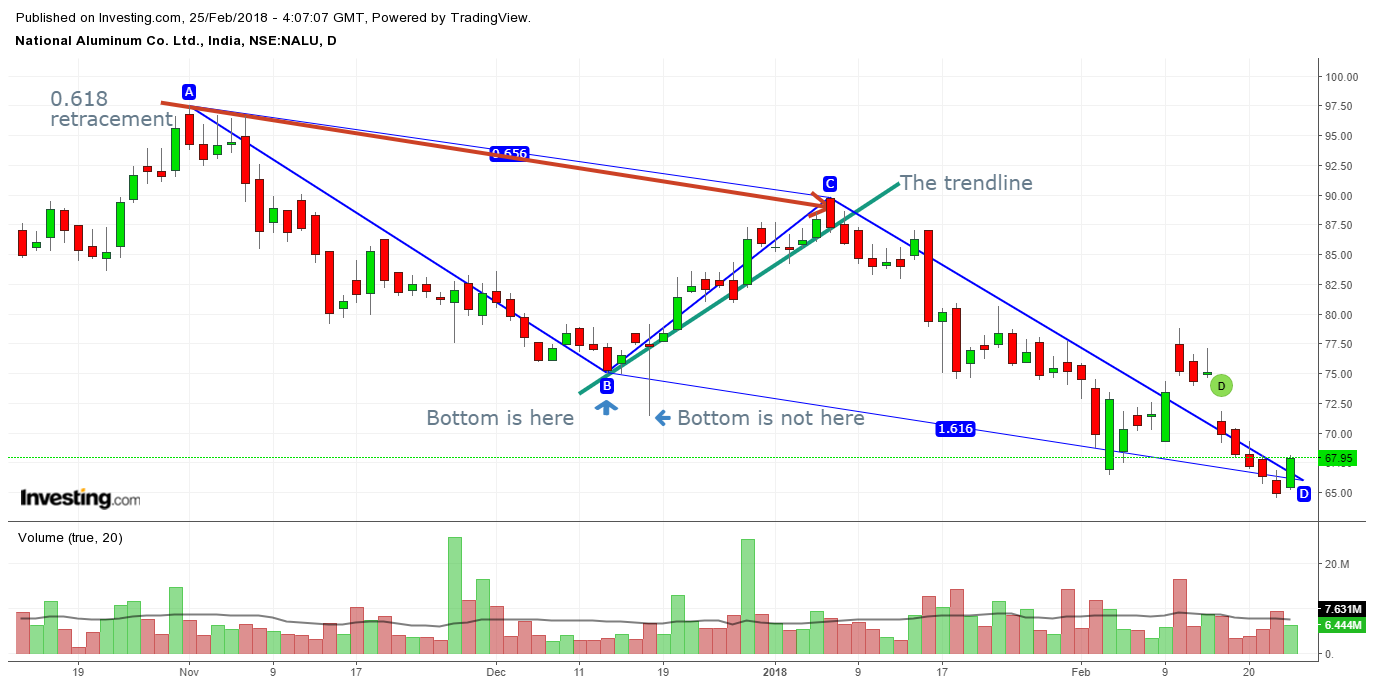
Accordingly the chart of NALCO with ABCD pattern can be drawn as below. The red arrow indicates 0.618 retracement. And BC projection has been taken as 1.618. So the chart and ABCD pattern remains valid with minor adjustments. The PRZ remains nearly the same.
So u mean to say, if there is small variations from fib ratios, it can be considered…
Good enough…
But what worries me here is, this pattern becomes so widely varrying with person to person…so u used a 0.656 in ur nalco example , i used a 0.707… Now u are retracing d point 1.618 at
Some where around 66 but i retraced 1.41 at much below point…
This will become a problem while taking trades…
Guess back testing will solve probs more…
In the nalco chart your point d does reflect reversal, do one thing… If u find harmonic reversal in historic charts, do post here for benefit of everyone…
I heard volatile markets like currency has a lot of harmonics…
Another thing i want to know, if harmonic and other patterns like double bottom has contrasting trends…
Is there any general impression which one presides…
Like in ashok leyland the double bottom was too powerful for the bearish ab=cd formation…
@Capsule91
My advice to you would be to revise your B point, and then you will reach the same PRZ that I have reached. The problem is that you are too strict in marking the B point in the chart. I must admit that interacting with you has enabled me in honing these patterns.
My feeling is that the war is not between two contrasting trends such as double bottom and AB=CD pattern. In case of Ashok Leyland the fundamentals seem to be having an upper hand, and after a long consolidation the stock seems to be ready for an upward journey. After an upmove, a stock becomes potential candidate for a downmove that is why we call it POTENTIAL reversal zone. But all stocks may not reverse from that PRZ. I hope this clarifies the issue.
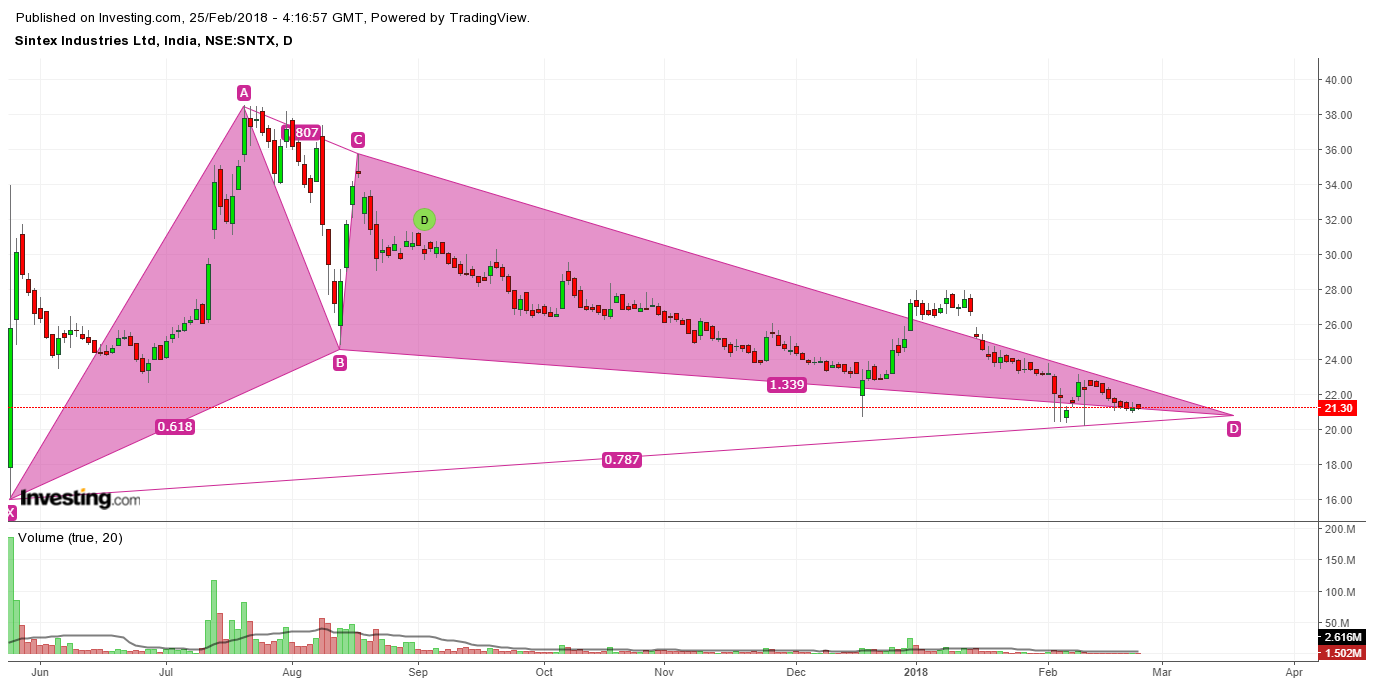
A bullish Gartley pattern seems to be forming on daily chart of Sintex Industries. A bullish Gartley needs precise 61.8% B point retracement of XA leg. In the chart this has been achieved by pulling the B point slightly below the candle—while an exact B point would have had a 60.8% retracement of XA leg. Other parameters of Gartley are intact. The potential reversal zone is about 20. @Capsule91, please have a look at Sintex industries, whenever you find some time.
Same here… Thats why i dont mind posting when even in doubt and people agree or disagree… All that matters, is what we take from here to the market…
Keep updating these harmonics when ever u find time i will do so too… Also post failed harmonics, that i feel is very important…hope u read the bamm theory, that combines rsi to predict whether the harmonic will fail in short term or not… But i want to analyse completely failed harmonics…
Include other trends also like falling wedge, tripple and double top and bottoms,triangles etc
Please update you finds in harmonic patterns in present or historic charts when ever u find relevance …
Also post about failed patterns if possible… I am interested to start a new thread about failed patterns specifically so that we can research why it failed and whats the fundamental’s contribution to the failure…
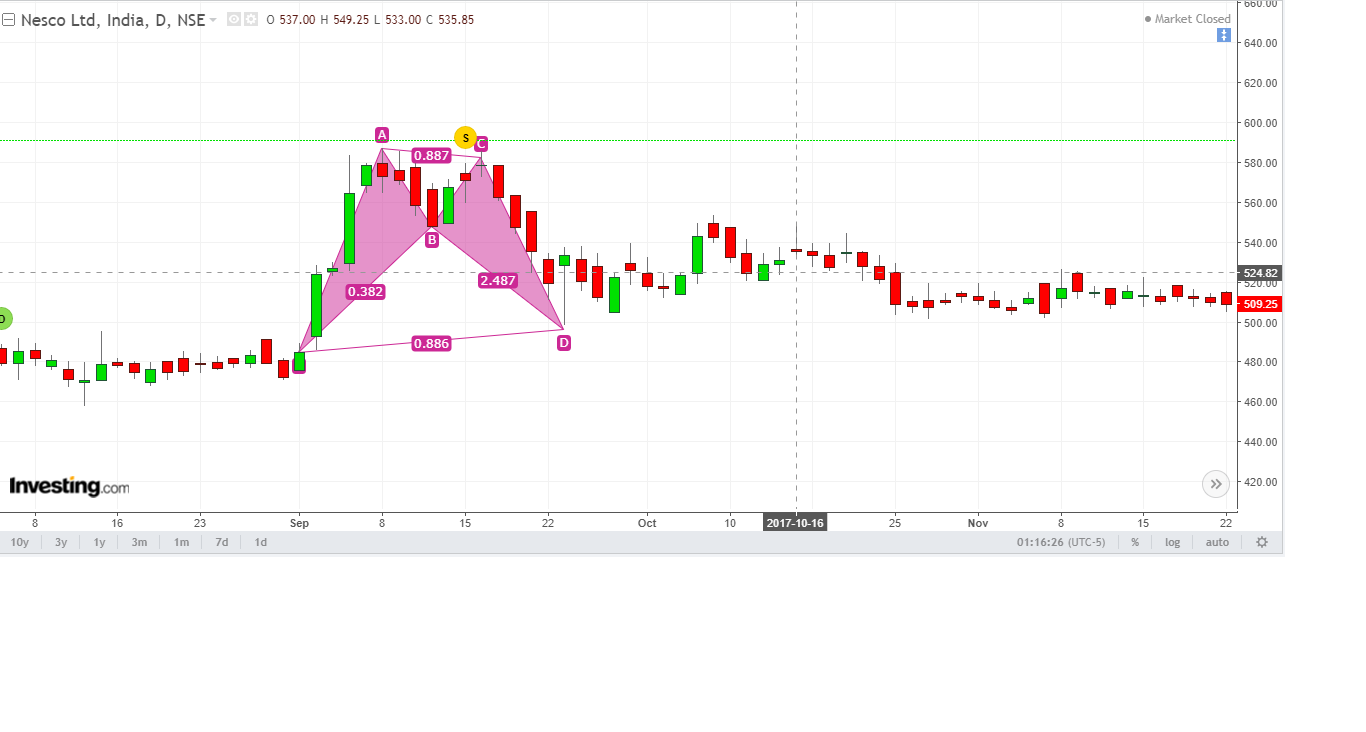
On the left down slope of the cup i noticed a bullish bat pattern… @Agarwala, i used ur advice on not beinf strict with tops and bottoms of candle and i think i will be spotting more patterns instead of rejecting them… tell ur opinions on this one…
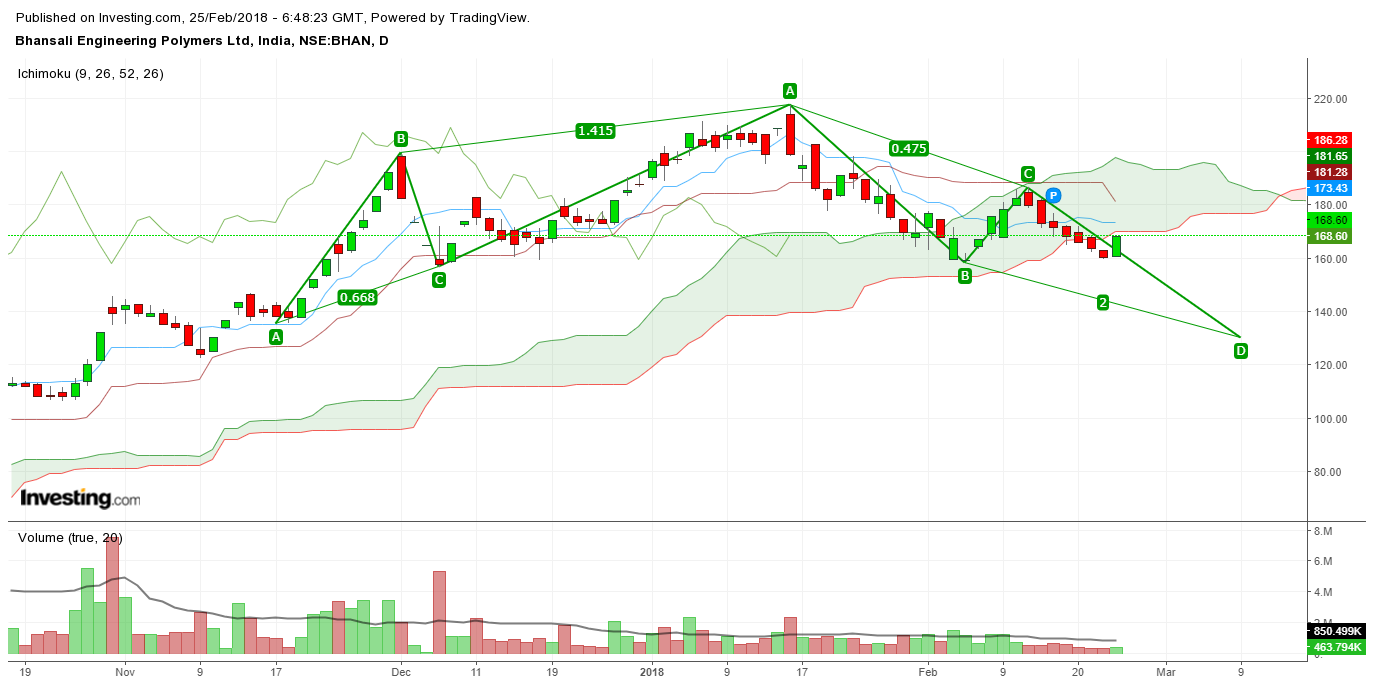
I had substantial profits in BEPL, but I sold much below the peak (after the peak was reached). Bearish AB = CD pattern clearly identifies the reversal point in the chart below. Pattern recognition would have helped me in selling near the peak. Moreover BEPL is now trading below the cloud for the first time since its bullish run started. Now a bullish AB = CD might be in the making with a PRZ of nearly 130. So the stock may test these levels before the uptrend is resumed.
To me, both 13th Dec and 18th Dec candles are fine to make point B.
Because 13th Dec candle forms a trend line and 18th Dec formed a huge price action and formed a low that was lower than 13th Dec ONLY because of Guj election results nervousness (it was not stock-specific price action).
So I’d even discard that low and go with 13th Dec low.
In other case, if you look at just the chart not knowing any info behind it (which is ideal, because charts discount everything), I’d go with 18th Dec candle.
In any case, the AB=CD pattern looks fine in both cases, and the PRZ will be different. But even that’s a matter of 2 or 3 points difference.
@Capsule91
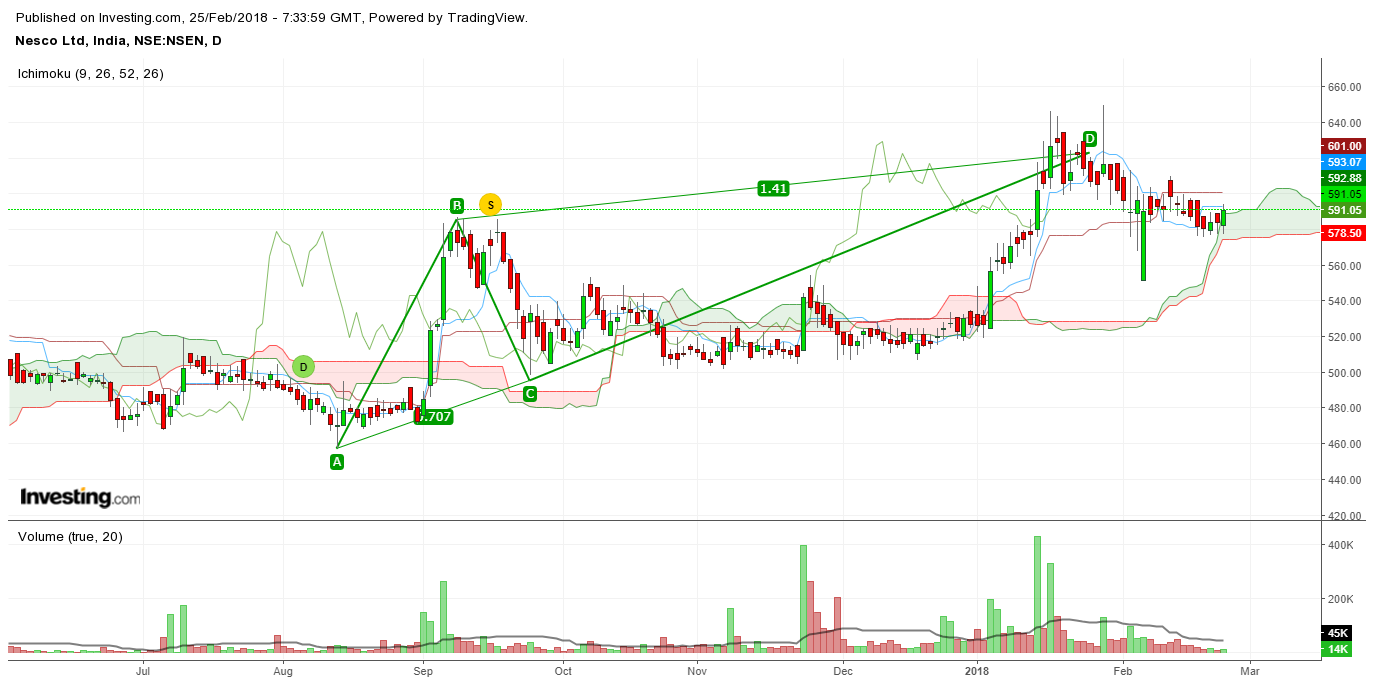
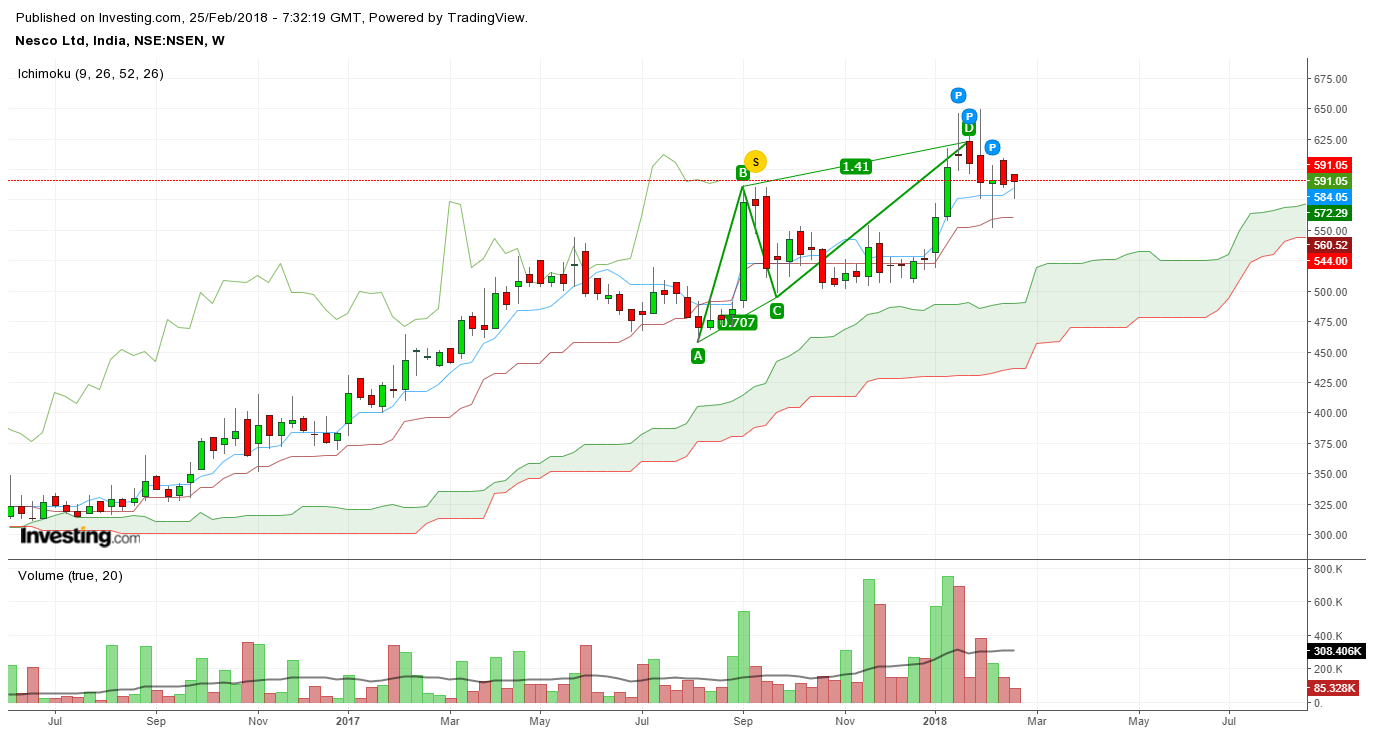
AB = CD pattern is suggesting 625 to be the resistance area. Also a number of red candles have formed immediately after the stock touched that area. A thin cloud is hovering just below the prices. Remaining above that cloud may be the key for the stock to rise. If it goes below the cloud, further downside can be expected. But like Ashok Leyland, it can rise despite a bearish AB = CD formation. A weekly chart is showing the weakness more clearly, and also the possible support area.
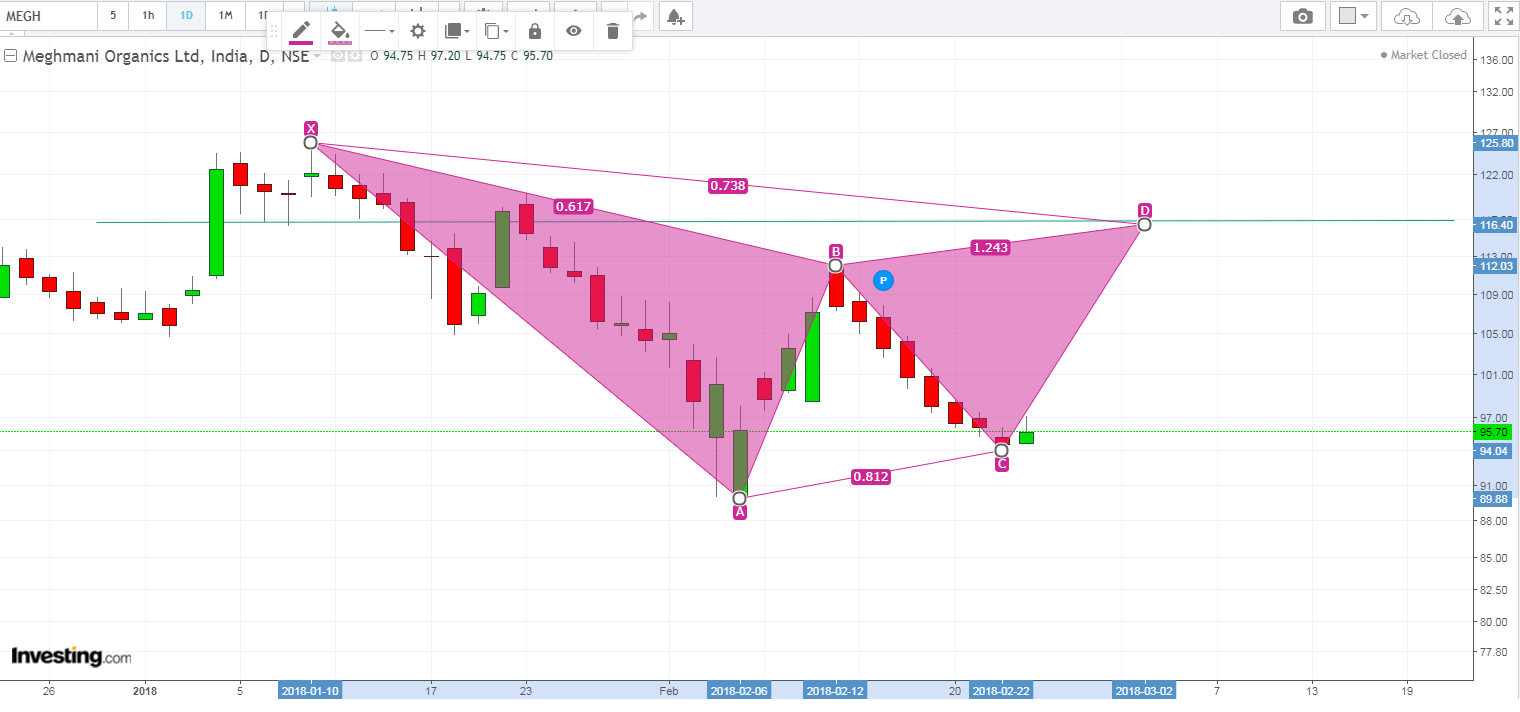
Meghmani Organics forming Bearish Gartley pattern. AB retracement is perfectly at 61.8%. BC retracement 81.2% is not ideal Gartley, but acceptable.
AB = CD is at 116.20.
0.786 retracement of XA is at 118.05.
D point marked at 116.42.
PRZ ranging between 116 and 118.
Chart below.
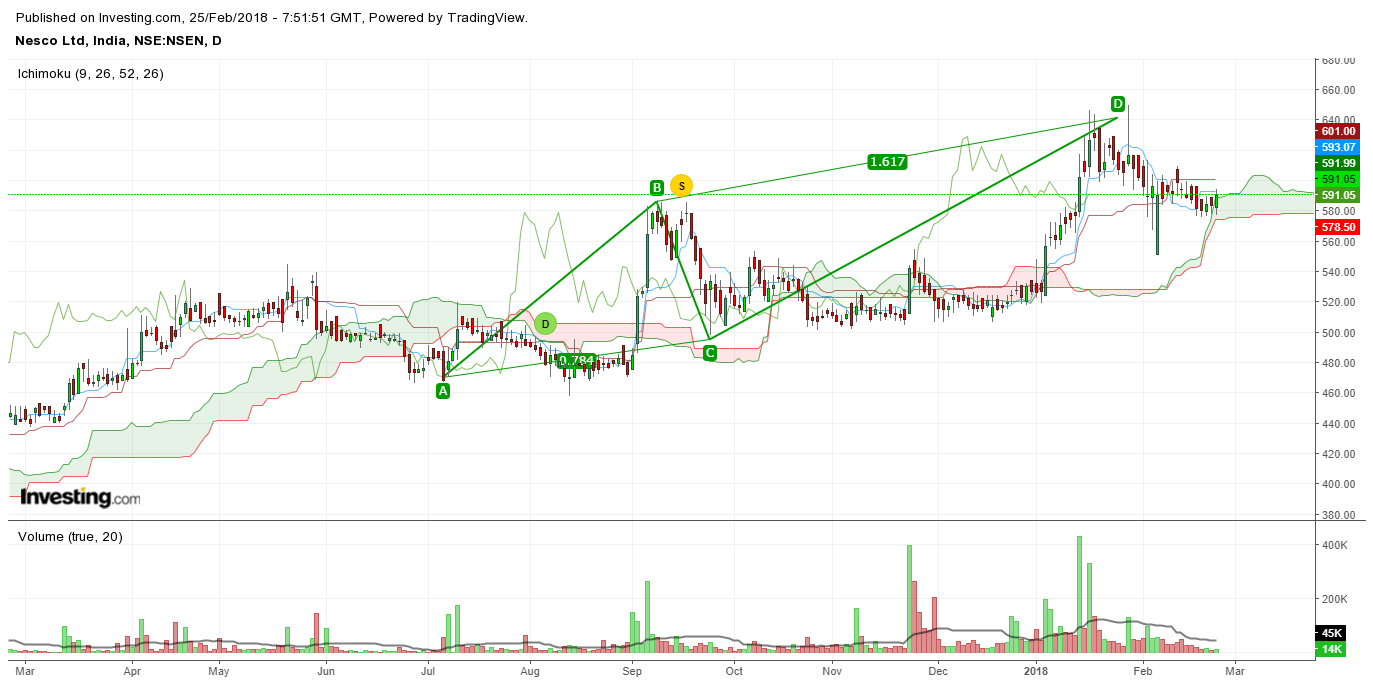
And wait and watch for a breakout above the 1.618AB level of 626 of the bearish abcd(in my monthly diagram) for the cup and hold to trigger the next upmove…
Or if the bearish abcd in @Agarwala weekly chart and mine monthly chart prevails the next course of action begins after a failed cup and handle pattern
We sud use the algorithms like this , right guys @Agarwala and @PE_Ratio…?
@PE_Ratio
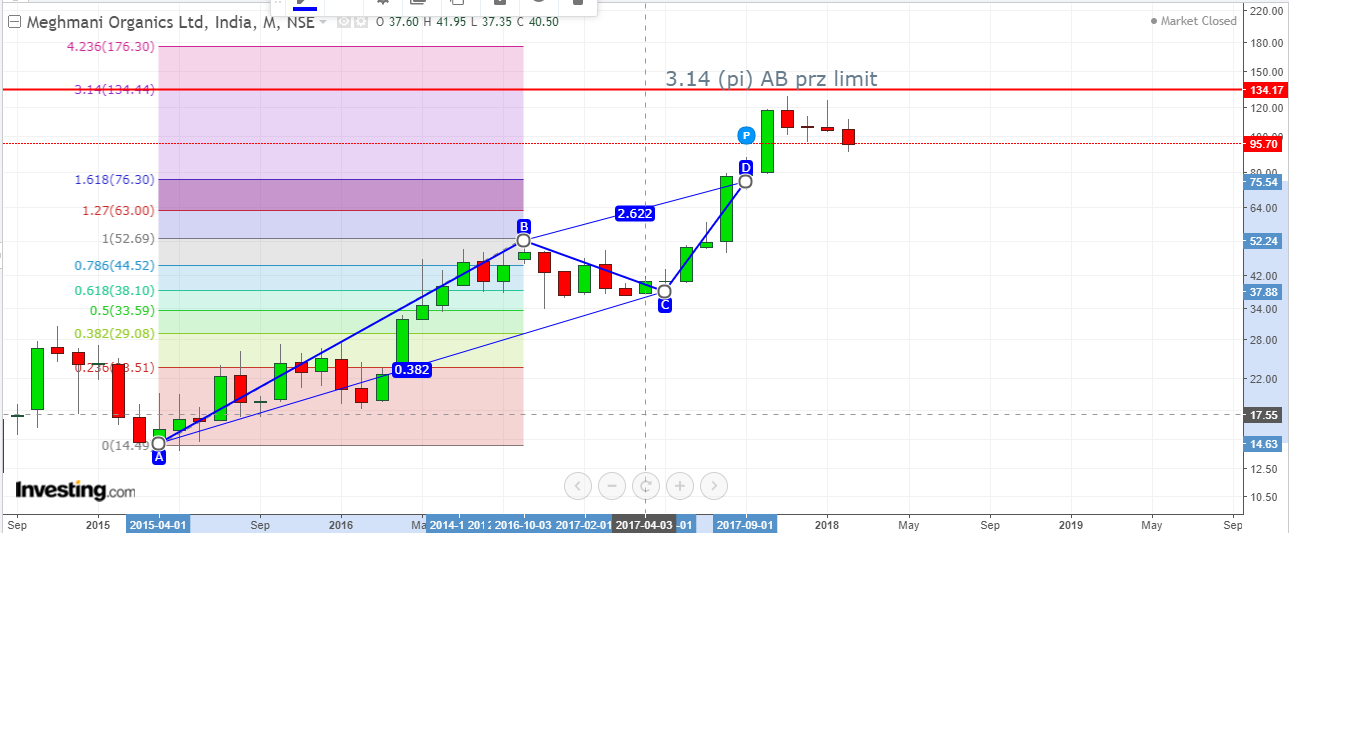
We are all in learning stage and keeping our ego aside. For the sake of this thread for learning’s sake, I will like to post the chart of Meghmani Organics that shows a classic Bullish Bat pattern with potential reversal zone at about 78. Here is the chart. There are two problems in your chart. Firstly its duration is small. We should take slightly longer time horizon. Secondly, and more important is that we do not know whether the C point has ended or not. After there is a clear upward movement from your C point, we can consider your point of bearish Gartley, but not before that. Till then it is a bullish bat.
If we keep the last objection aside, your formation of Bearish Bartley is technically perfect.
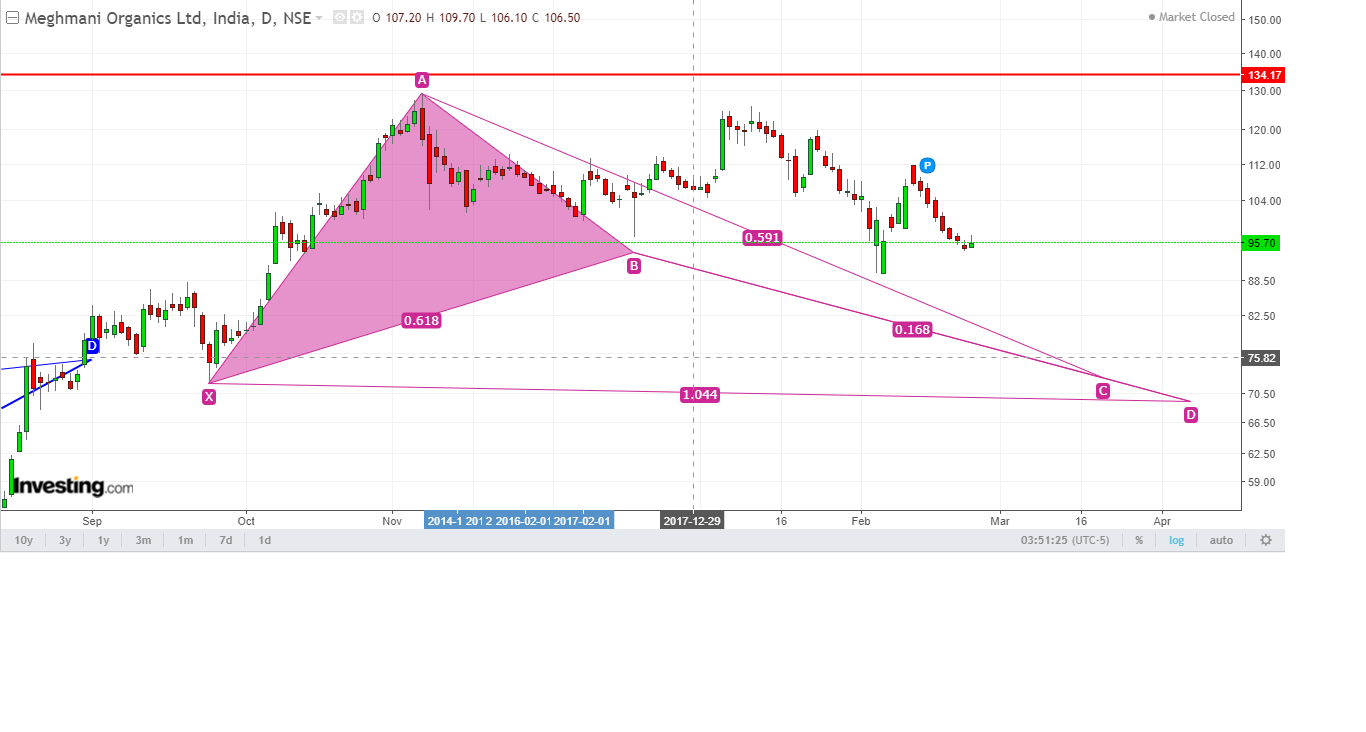
@Agarwala Good observation in a longer time horizon. It could very well be that we have a bearish Gartley pattern forming inside bullish bat pattern. In this case, first it will complete the bearish Gartley and reverse somewhere around 116, start bearish moves towards 78 (PRZ for bullish bat) and then continue the bullish reversal.
See the 0.618 mark is way far, and pe ratio is right, in nalco i was wrong to take the 18th dec doji coz that was a special case of maddness, similarly here also its better not to take the 18th candle and form a bullish gartley, also in this gartley the AB=CD is not equivalent…
It can be a bat though, have a recheck…
Totally agree. C point is not yet complete. This may be C or it can be even lower. We have to wait for few sessions to confirm if it is forming bearish Gartley.