
This rather looks like a cup without handle.
1 Like
@manish962 sir,
The following is my explanation for the atypical nocil cup and handle formation…
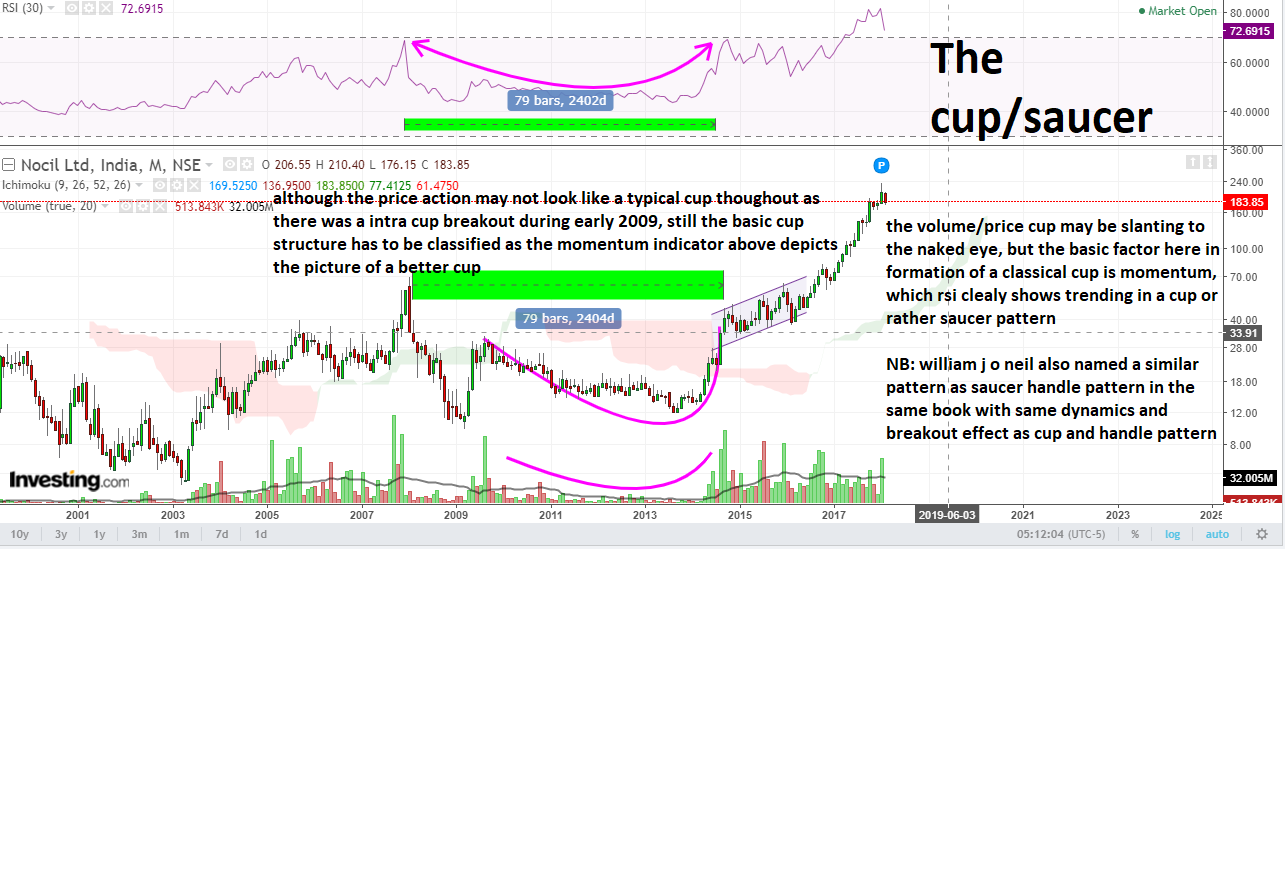
What i have experienced in my short span of technical experience is that the classical cup is seldom encountered and variations happen and confound our naked eyes, but because the basic theory behind cup and handle formation is momentum , using a good momentum indicator can be used to reconsider the bias…
Here i will be using RSI and Chaikin Money Flow to keep things simple…
I will keep the fundamentals aside, as i am using pure technical parameters to avoid bias…
1.The Cup…
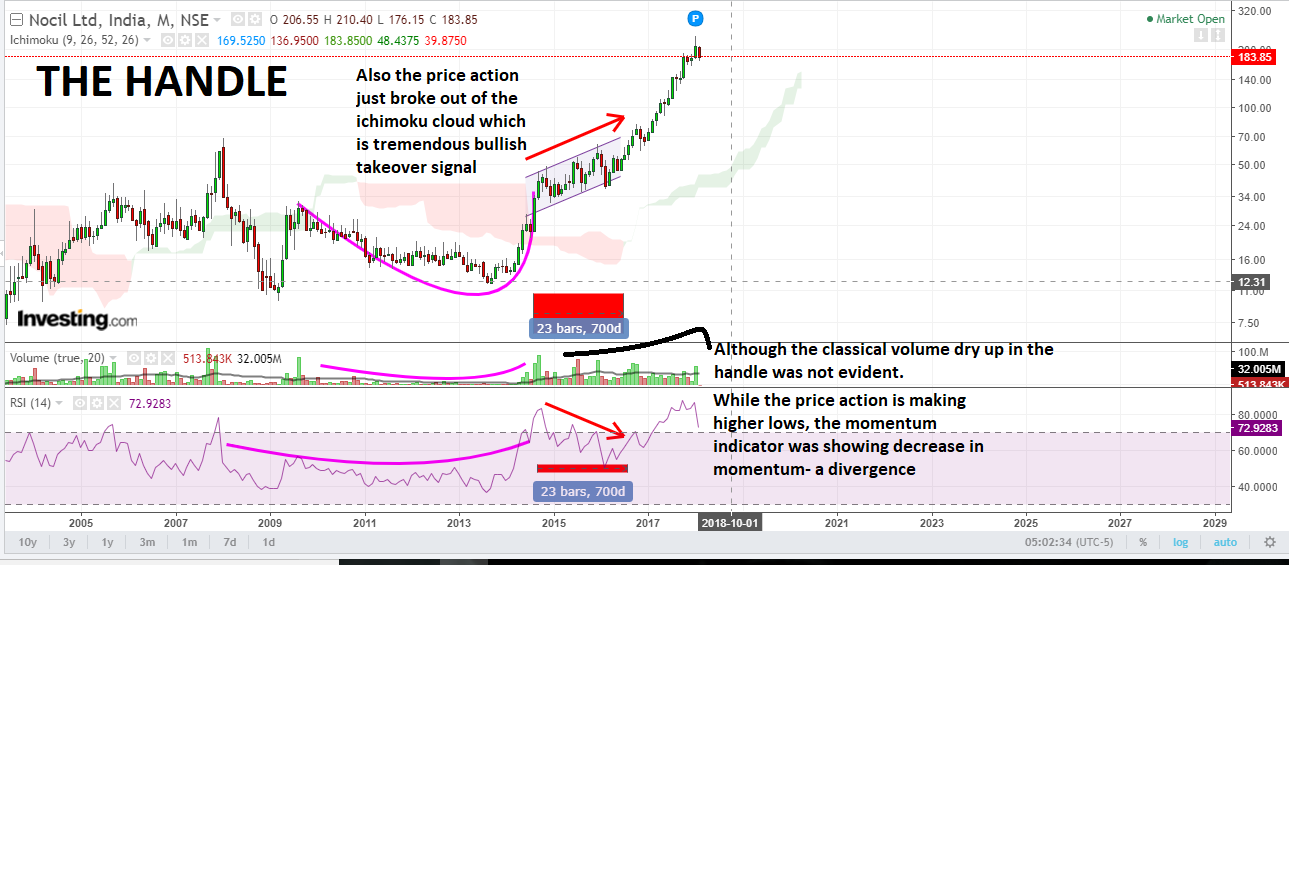
2.The handle
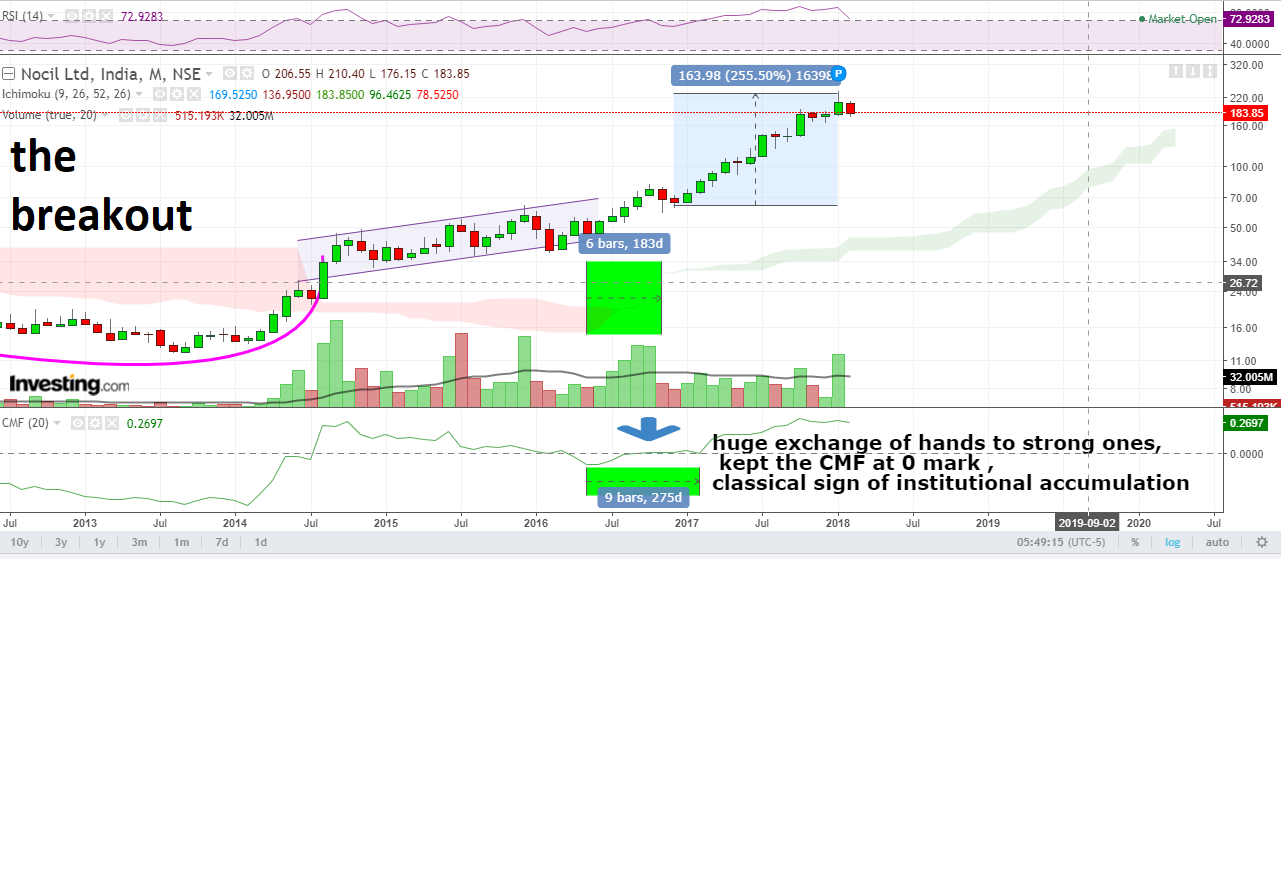
3.The breakout
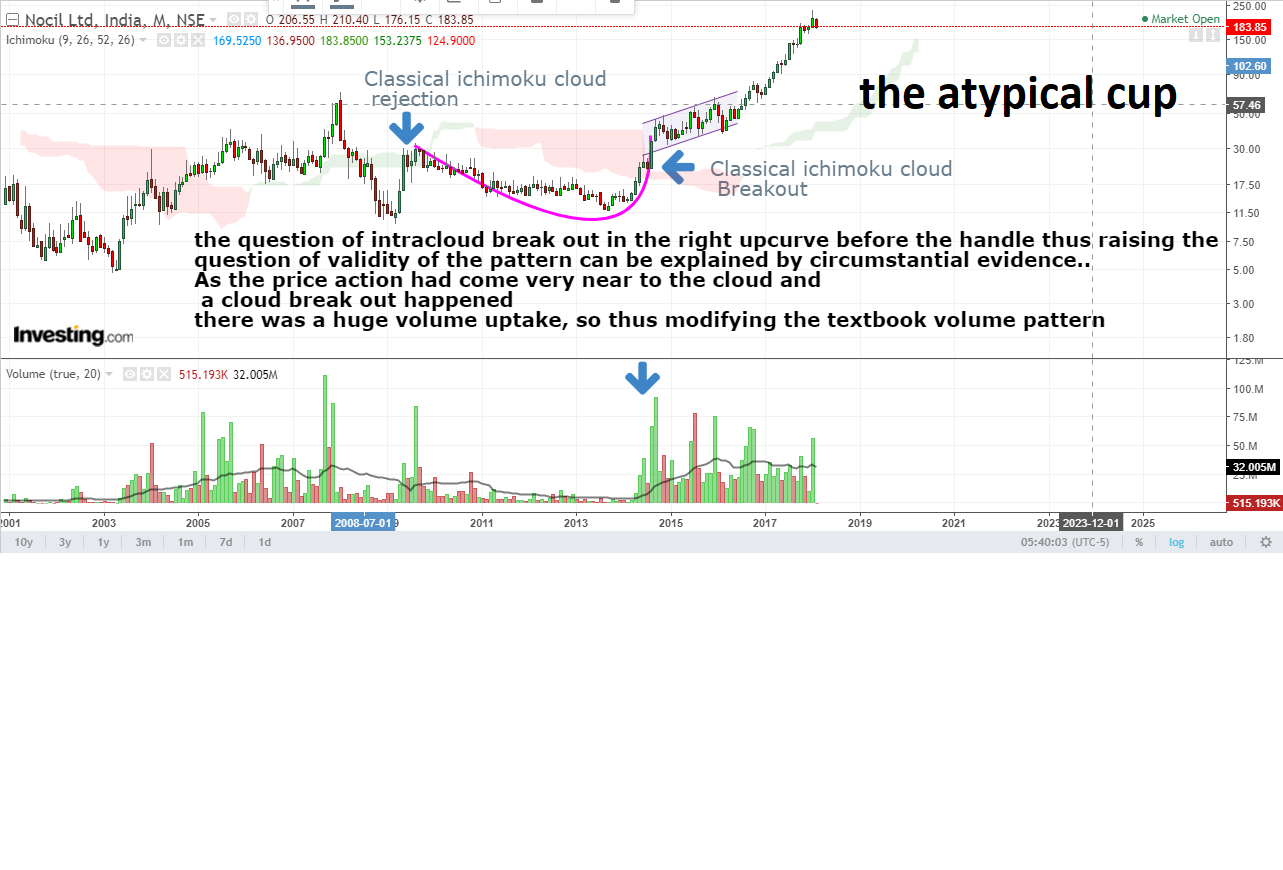
So a very atypical cup to the naked eye can very much be a true cup and handle pattern hidden in other technical parameters…
William J oNeil in 1995 in his book stated that upward looking handles have higher failure rates…
So as a lesson from the master, if we adopt to be careful and watch for a divergence in the handle with a momentum indicator , even a upward looking handle can be a potential joker in the pack…!
And cups might look very volatile in the base, but we can be careful and add a momentum indicator using a higher parameter (like i used 39 in rsi, to minimize the vibrations), and we may come out with a great cup actually…
Here in nocil there was a massive breakout even after this atypical cup and handle, and the breakout happened throughout 183days and chaikin money flow showed strong accumulation during the breakout thoughout 275days , a double whammy …
The result was magnificent… 255% upside…
Disclaimer… Not invested, not interested, not at all a buy, sell or hold recommendation, purely was a experimental backcheck of theory…
2 Likes
A very good cup that failed to form a good handle. Handle dropped 48% from the high (pic says 65%, but that’s wrong). Still can keep an eye on it to see if market sentiments change here.
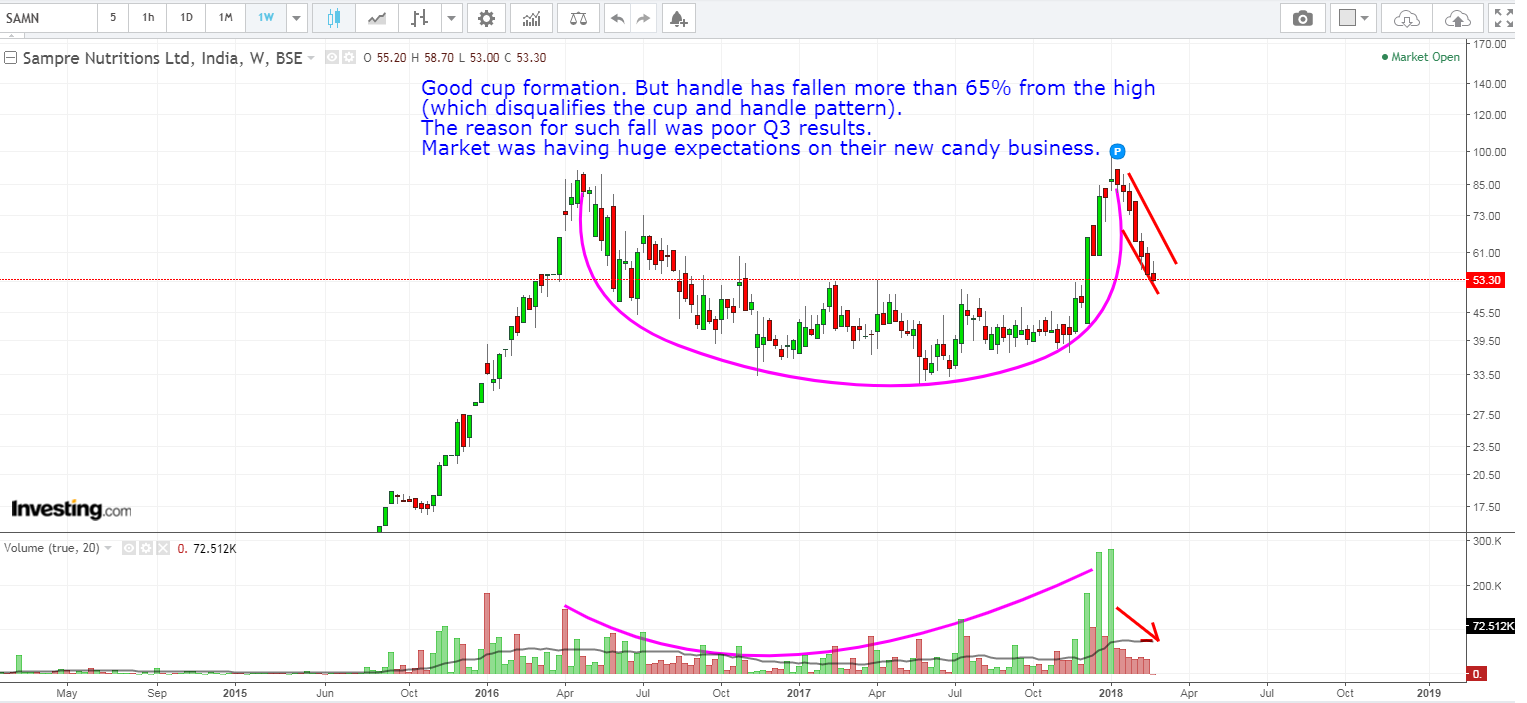
Disc: Not invested. Just watching.
2 Likes
Please note all the charts are weekly or monthly and these patterns have formed over several years , and these are very powerful trends…
As @hitesh2710 sir mentions , combined with fundamentals these tried and tested patterns can be used to generate substantial returns…
William J O’Neil, the creator of cup and handle ans saucer and handle patterns , demonstrated these on weekly charts only…
So this is a total misconception if u feel these are trader stuff…
You as a value investor should respect the market and these patterns while may look too technical , but u cannot forget why technical analysis is done, charts reflects how the market is viewing the company …
And there is nothing called value investor i believe, there is a investor and a trader, without growth u cannot create value and without value growth is impossible…what you mention is a part of fundamental analysis, if that is one leg, technical analysis is another…
If you get a great company at very cheap valuations with growth potential and invest blindly, where the charts were showing that was a double top you were investing into , and after that double top you price depreciates by 10% and then goes on to be a multibagger, you actually lost atleast 100% more profit if you had sense of the charts…
While it is impossible to predict the market, one should atleast assess risk reward ratio during entry, and u need to use charts…
I have tried "“buy when u have money, sell when u need” strategy by great ramdeo and i lost potential returns…
there is a logic in everything we do in technical analysis, if you have this idea, i request you to gain more knowledge because you are too ignorant about this…You are missing a wonderful source of power to make better profits…
Lastly, i am also a [value] investor, and hence i am not interested in daily or hourly charts, and all weekly even yearly patterns have been posted…
Please enrich the thread with your technical analysis which is very welcome, if you have other investing opinion , valuepicker has wonderful threads to discuss and learn…
For specifically charts may i suggest, William Jiler’s 1962 classic, How
Charts Can Help You in the Stock Market
9 Likes
BODAL CHEMICALS
This is an inverted cup in formation (SUSPICIOUS)…
There has been a very huge split amongst trader community whether inverted cup and handle is a trend reversal or continuation pattern…
William Jiler was of the view it is a trend reversal, while Mark Boucher used it as a continuation pattern…
Although debated, i would like to monitor bodal over the next year how the pattern turns up to be…
Otherwise, there is a definite volume cupping with inverse cup of the price weekly charts…
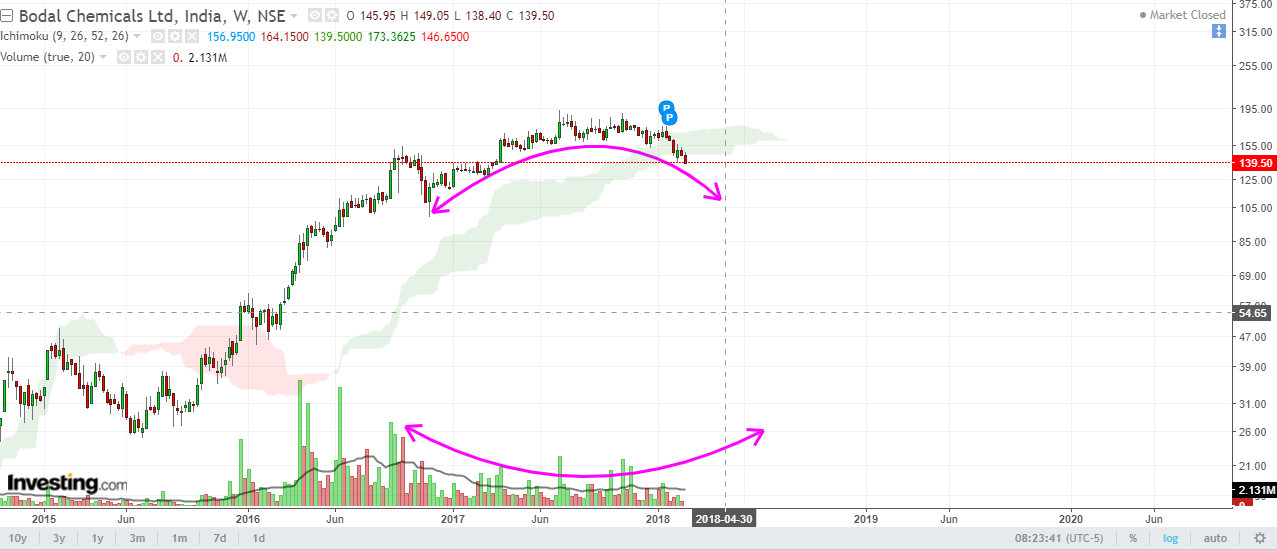
Disclaimer… Not invested or interested
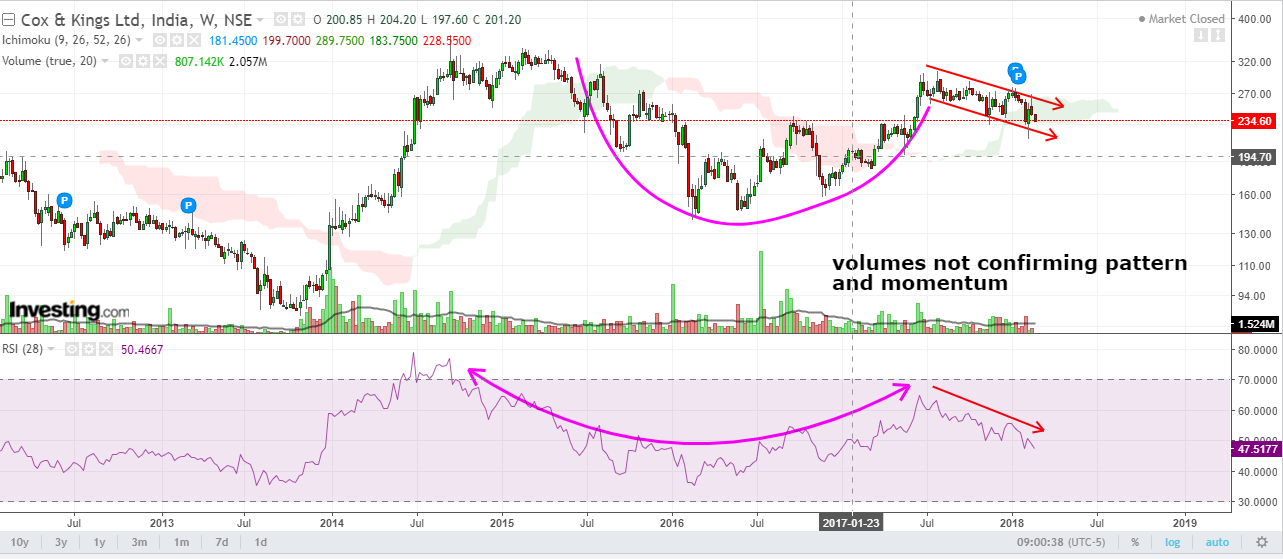
CAPLIN POINT LABS (weekly)
Another interesting chart, where there was a cup and handle classical textbook pattern which broke out the initial bull run, but just after the breakout there was a bearish divergence with rsi and price action (not market in diag.) and the break out run was flattish but still effected a 124% run up…
Now i see another inverted cup in formation with very intriguing textbook parameters supporting, this pattern will be very interesting to watch over the next year…
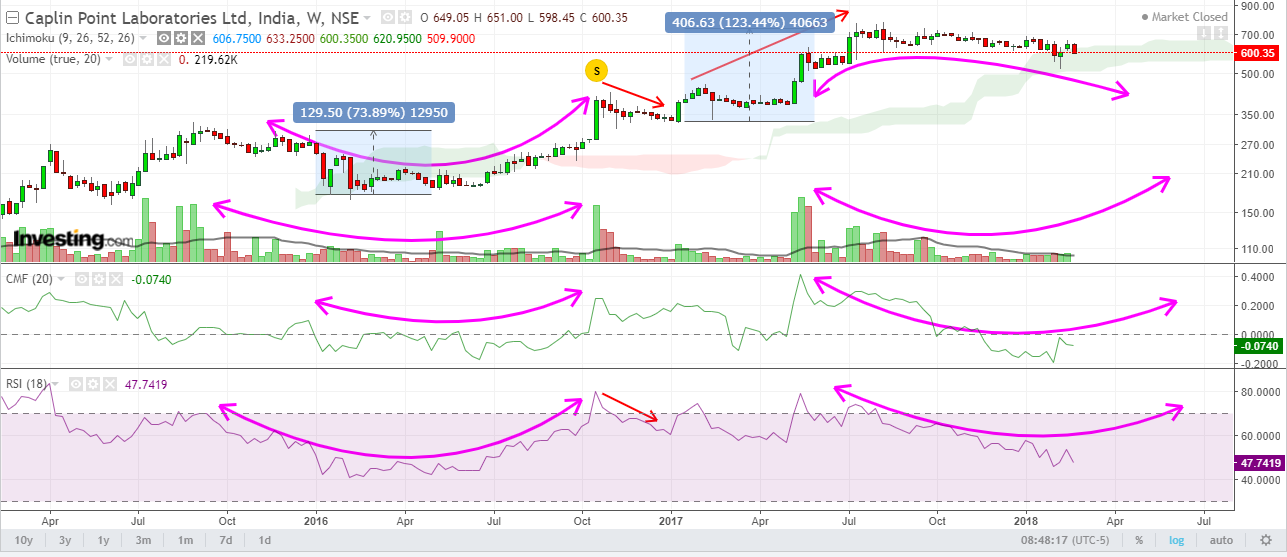
Disclaimer… not invested nor interested, watching
Very interesting thread . . .
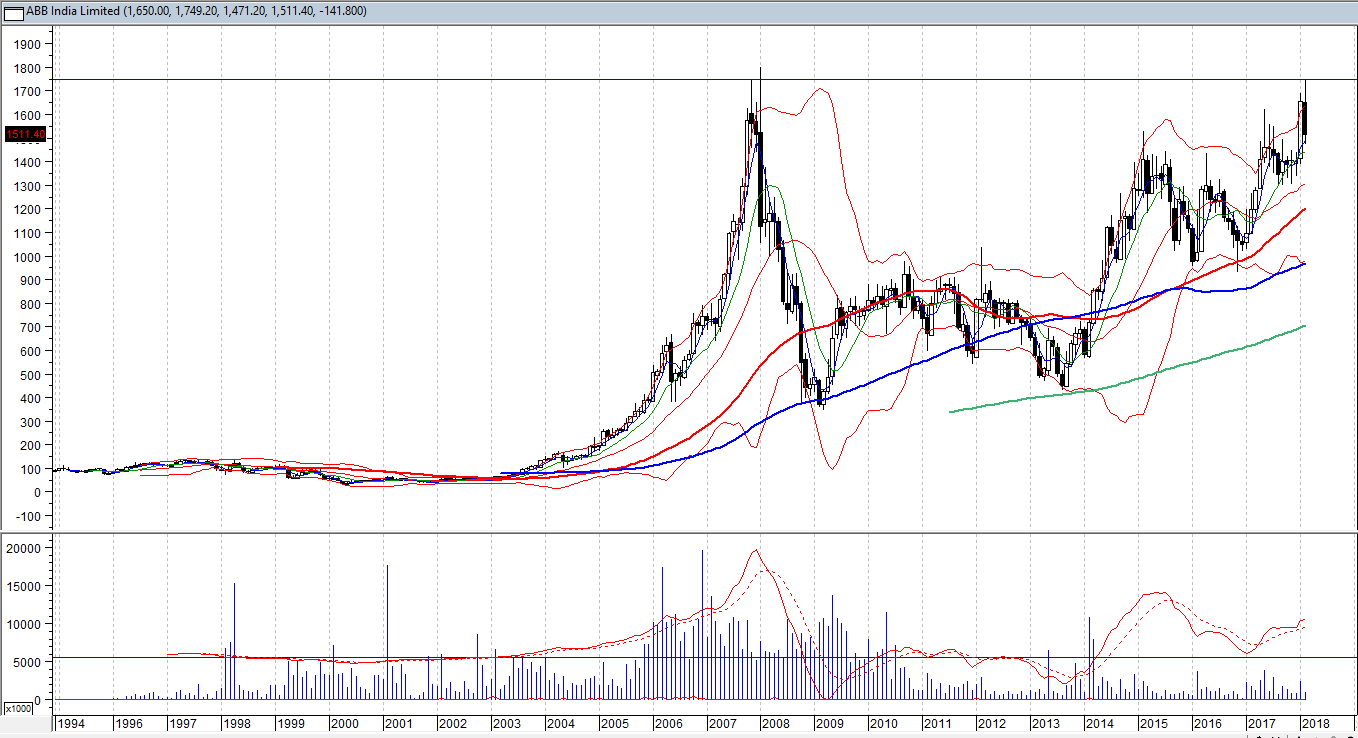
I do not have much knowledge about technical analysis. But I believe it is essential tool for investor. I have come across the chart of ABB. @Capsule91, if you will please analyze and post your ideas. This is a monthly chart. Thanks in advance.
1 Like
In case of Bodal chemicals it is a classical rounding top formation. The levels of 125-135 need to be watched for support. If it doesnt get supported here then there can be an accelerated fall.
2 Likes
Is there a difference between a value investor who buys 100rs worth share for 50rs and another value investor who buys the same 100rs worth share for 60rs? Yes, there is a huge difference. Let me explain how. If you ever know about the 7th wonder - compounding, you will know the difference. Suppose assume both of them sell the share after 10yrs for 1000. Let’s calculate CAGR for these two value investors
Value investor who bought the share for 50 rs - CAGR = 34.93%
Value investor who bought the share for 60 rs - CAGR = 32.49%
A difference of 2.5% CAGR over 10 yrs is a huge amount. This is where Technical Analysis can help value investors. Both of the above investors are value investors. They buy something worth more for less price. But what made the difference is their entry point. TA can help one enter at the right time. When one can find the breakout point and enter just before the rally starts, it’ll vastly improve your CAGR.
If Fundamental Analysis is king, then Technical analysis is crown, that makes him look like a real king.
6 Likes
If you become an expert in Elliott Waves and are able to find the right wave count and are a value investor, then you’ll make wonders w.r.t returns. Price action moves in waves, usually in the count of 5. If you enter a scrip during wave 1 of a 5-wave advance, then you’re in for a heavy bull run. In the same case, if you enter during wave 1 of a 5-wave decline, then you’re in for a strong bear run. In that case, your wait time in the scrip is going to be much more than you expected (maybe 4 or 5 yrs more than you actually expected). So, don’t treat people who are interested in Technical Analysis as traders. Even long-term investment needs Technical Analysis for greater returns.
4 Likes
@Agarwala this one is tricky and i am just a enthusiast and a student of technical analysis, so my qualification to make a competitive analysis…
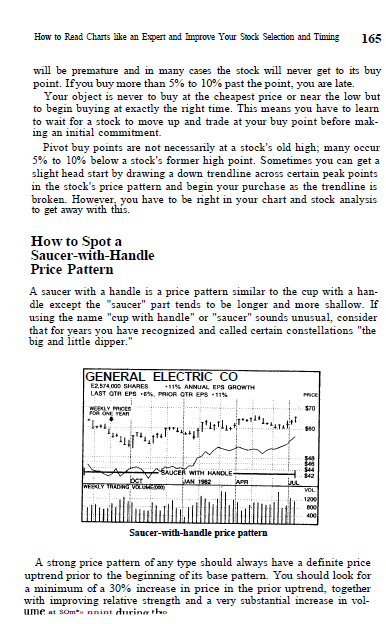
This dosent qualify at all as a double bottom but looks like a saucer with handle…
Check out the introduction by william neil about saucer with handle…
and in your monthly chart, there is a ichimoku cloud reflection during first 4 months of 2017 along with the conversion and base line split which indicates a breakout with moderate volume…
All this is in the monthly charts…
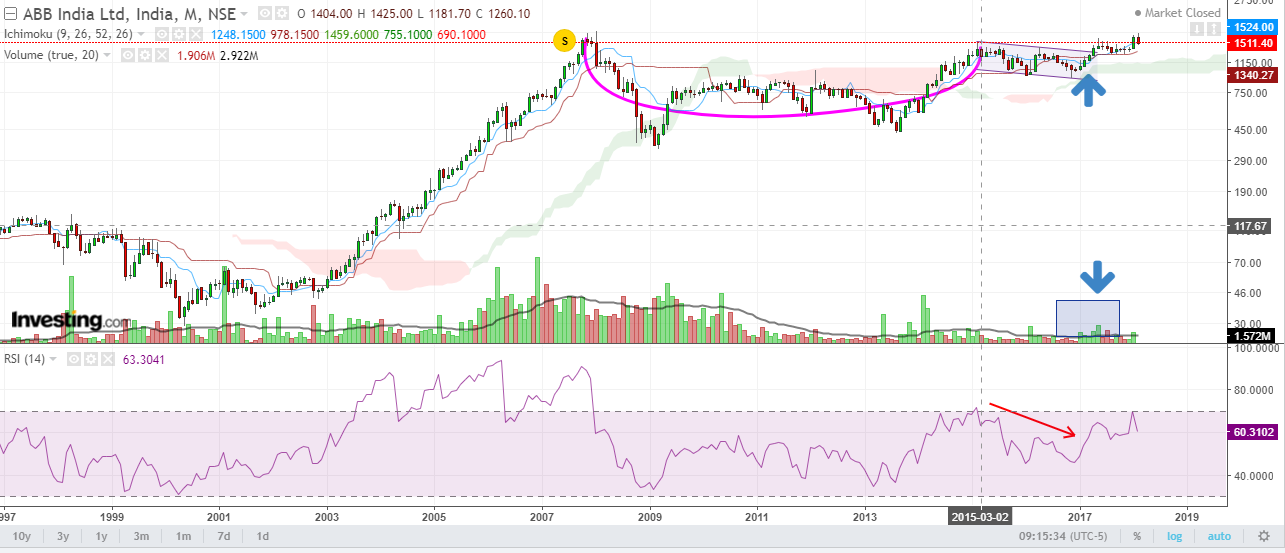
I would request others to give more inputs on weekly and daily charts or any other view if possible…
Disclaimer… not invested , not inetrested
Absolutely sir, plus for Bodal the whole of 2017 was a year of divergence of price from momentum,
But sir, i have come across a number of theories which mention about inverted cupa dn handle pattern, and a lot is debated about it…
What is you take on that, can you please elaborate?
What a fantastic depiction!
Thank you for starting this thread and the wonderful discussion around Investor//Value Investor and trader.
IMHO every investor ( not trader) is a value investor in terms that when we buy something we see value in that. Its just that definition of value may differ.
As described in Hitesh sir’s thread ( combining tech with fundamentals) , if we can use these two Arts in sync, it can benefit immensely.
Before I started learning about Tech Analysis, I was always confused as to what levels are gud buy range for medium (start accumulating) to long term ( increase allocation if story plays well). This is where tech analysis has helped me a lot. I start buying from first support level and then increase at every next support if I like the story based on my fundamental analysis. Same with selling, at times to bring my average price down I sell a portion at levels I feel it might get selling pressure and then buy them back from supports, but this few times has back fired.
Just an example, take the Nifty Index itself. It formed a nice cup and handle on long term charts and corrected from levels close to as derived from cup and handle
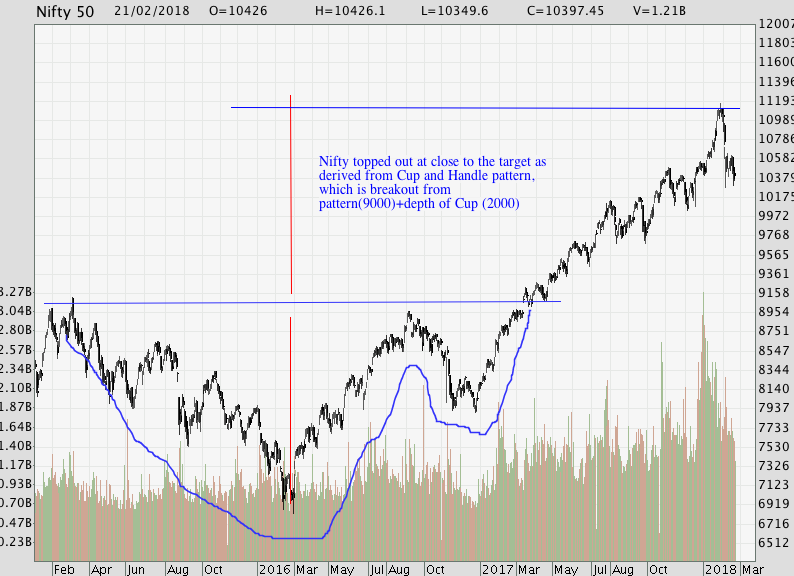
In short , it can make you a lot of money when clubbed with fundamentals. And for traders to make money using Tech Analysis, you need to be very very good in this art.
Disc : I am not a trader, use Tech analysis only for medium to long term investing.
2 Likes
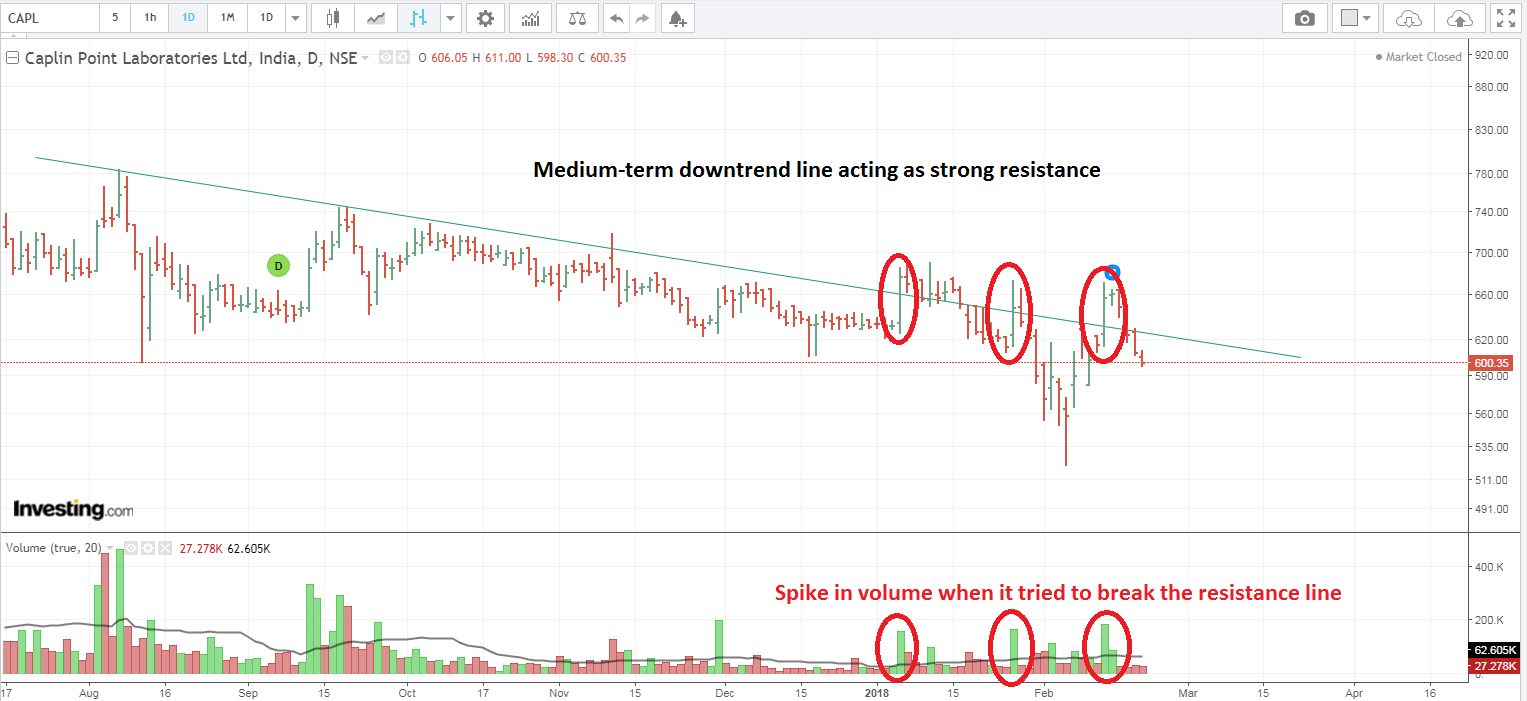
I have posted a chart on caplin point here, i am sorry, valuepicker dosnt allow forward looking statements with price movement
Sorry for posting the technicals of Caplin in this thread. This is what I see. The medium-term downtrend line is acting as strong resistance. It tried to break the resistance line with more volume 3 times, but failed to stay above the resistance. As long as it is not able to break this resistance line, expect downtrend to continue. If it tries again to break the downtrend line with huge volume (same as last 3 times), it wouldn’t be enough to stay above the resistance and reverse to an uptrend. You would like to see more volume than the last 3 times. If you see that 2-day close above the line can be a signal for trend reversal. Also check other indicators for confirmation. Check the chart below.
1 Like
@valuestudent I’ve never heard of Ken Fisher’s method. It’s something new. I believe that it’s not pure technical. Since this thread is meant for finding chart patterns, there is nothing wrong in asking to create a new thread of Ken Fisher method. If we have a dedicated thread for that and people who know about it well share their knowledge, and analyse few companies based on that method, many of VPers including me will get something out of it (instead of posting here and getting lost in between 1000 other patterns).
I request members to keep focus on the technical charts, which i am Only interested in this thread or i am sure others will be too…
If you have a criticism on any of the charts feel free to counter with charts or specific points…