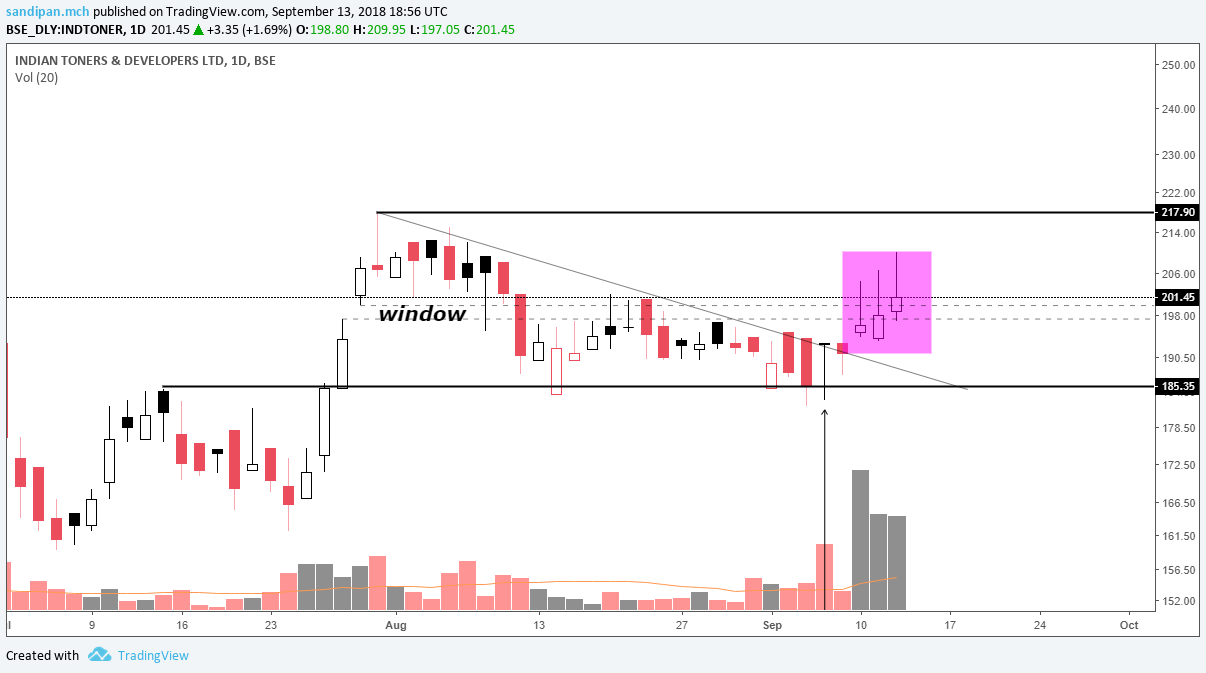
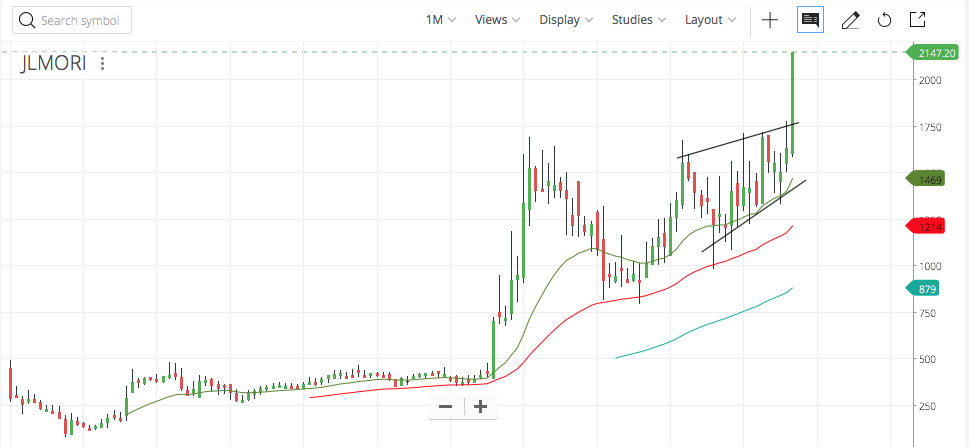
although there are a couple of good things in this chart, it would be a bit too early to call it as a break out , unless 217 is taken out by a positive closing
although there is change in character, across 185, as it has been tested 2 times, second time with a bigger volume forming a dragonfly doji, confirming support
the local supply line also broken out…
but i noted, there has been a window, which is also acting as a resistance…
and i wonder, why all these huge volume offtake, and no resultant movement in the price, maybe because of the bearish broader market
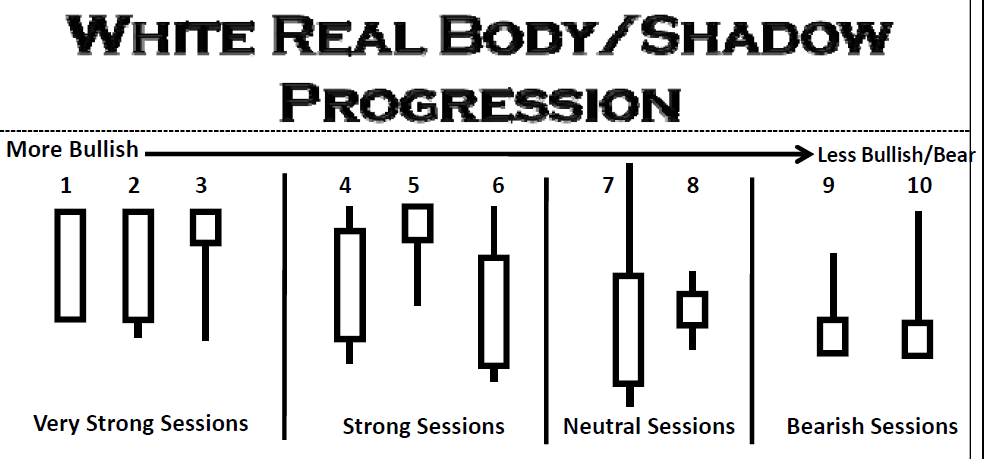
[infact the price is stuck within the window, and is generating upwicks, the resulting candles are actually the weakest of all bullish candles as described by nison]…
was familier with the pattern , but not its significance, so had to go back to the books…
turns out to be a good reversal signal…
excerpt from nison’s original text on candle sticks, which got the western world in total frenzy in 1990s…
As mentioned, a doji preceded by a long real body is called a harami
cross. The harami cross carries more significance than a regular harami
pattern. Where the harami is not a major reversal pattern, the harami
cross is a major reversal pattern. A harami cross occurring after a very
long white candlestick is a pattern a long trader ignores at his own peril.
Harami crosses also call bottoms, but they are more effective at tops.
here is the part , if any one is interested for more details…
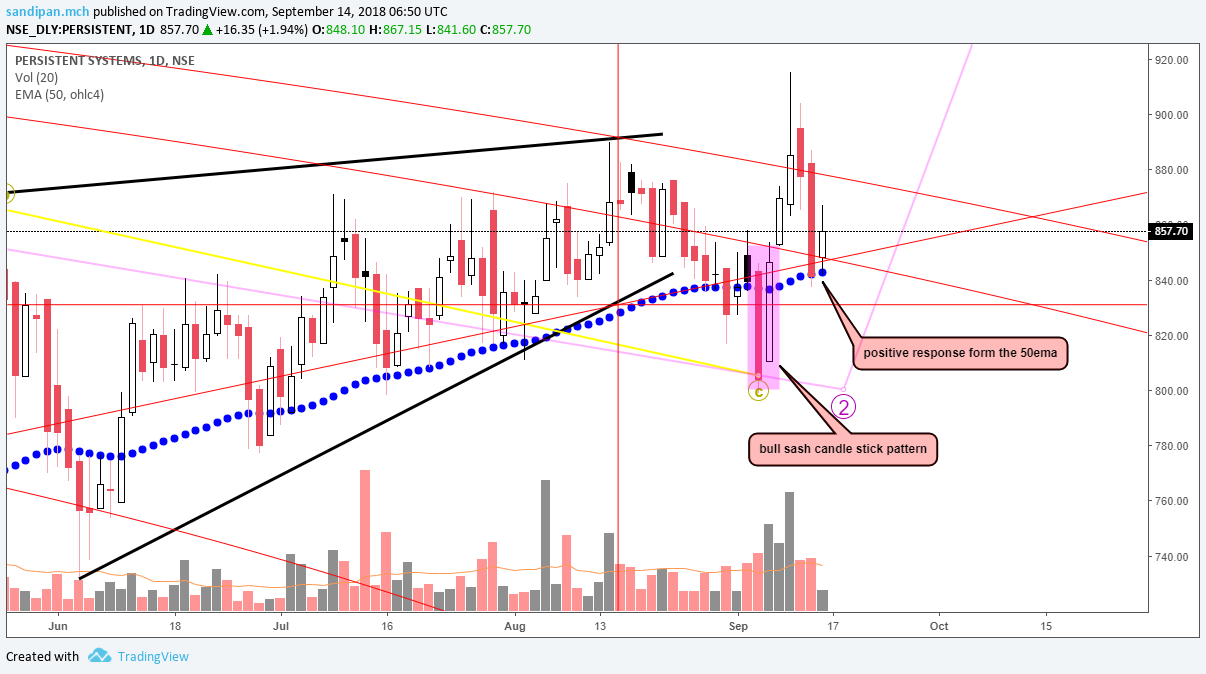
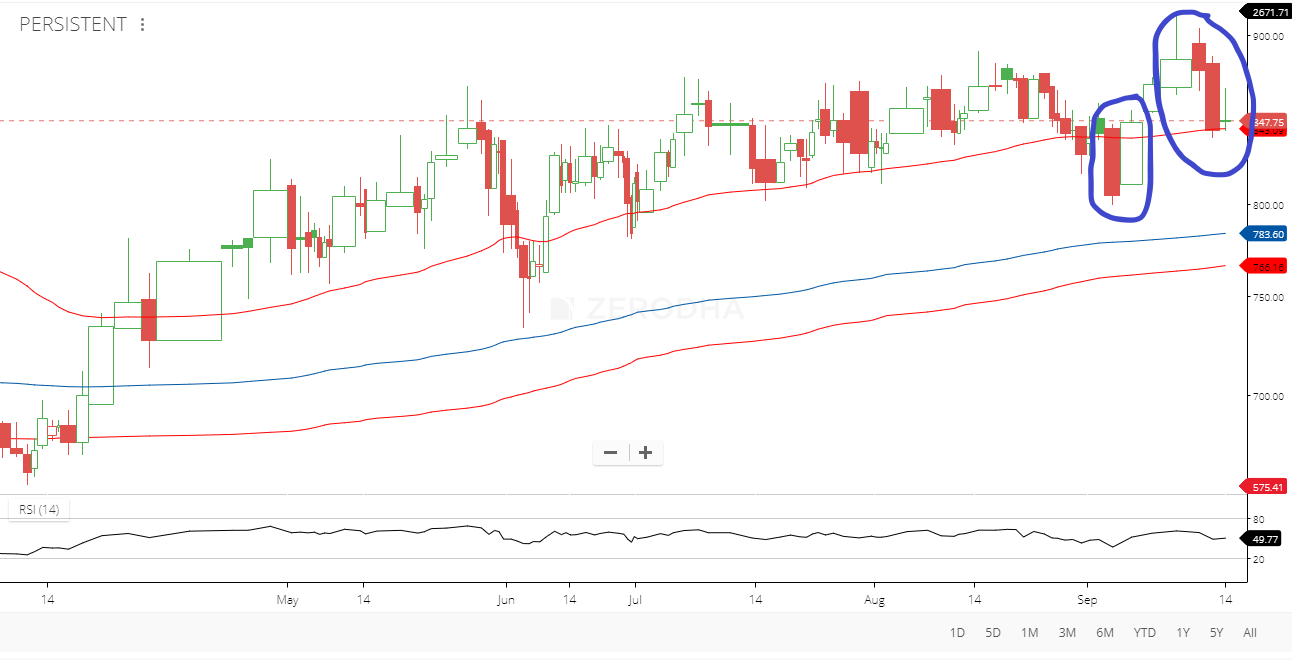
so as mentioned, it is more significant at the top, incase of the candle formed by persistent today…it is at support
it formed at the 50ema, so might be a very interesting candle…
monday will be a day to watch…
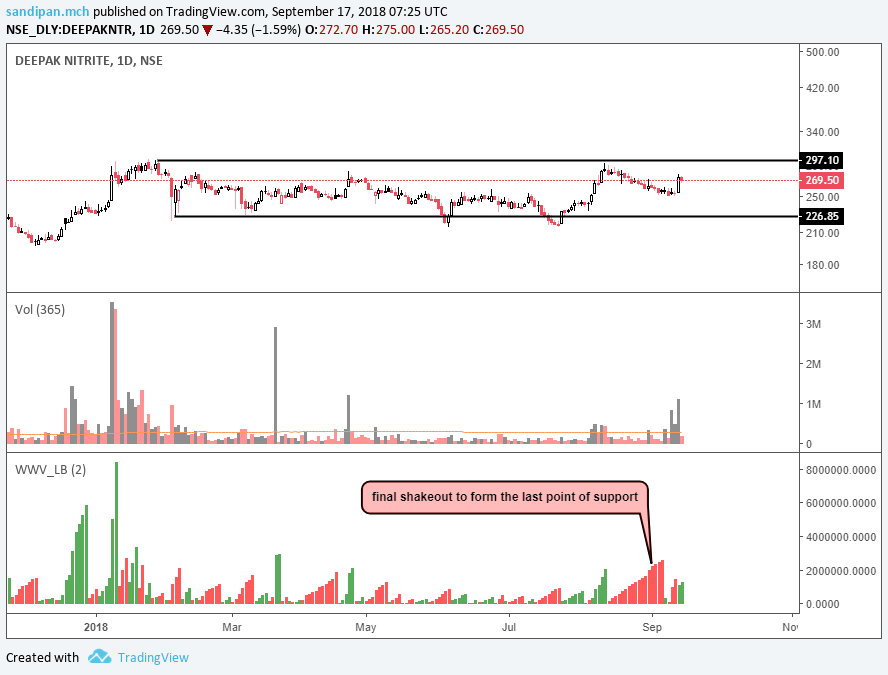
the doji at the trendline support and change in trend… thats a clear spring action in phase c… it should show strength now, then form the last point of support as the wyckoff accumulation schematics goes traditionally…
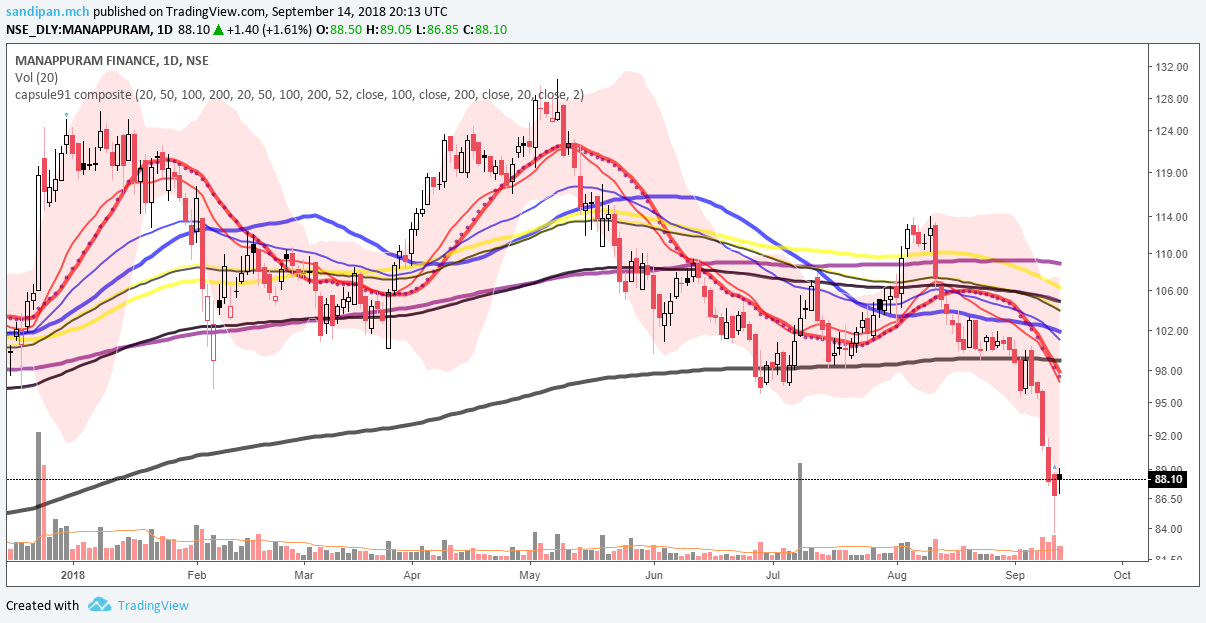
manappuram is into markdown now…
timing of the post was great…
the talk all around was bullish when this was happening, except @hitesh2710 sir, was a contra view, spot on as expected fundamentally…
well, the technical if read right can help a lot…
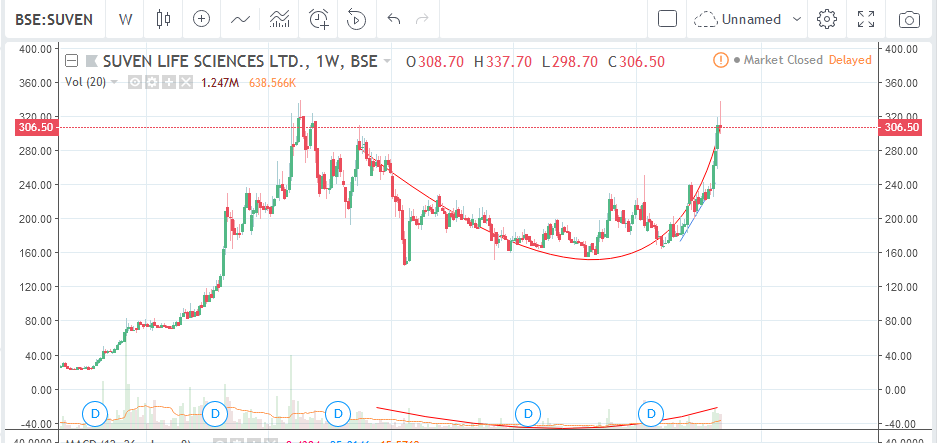
i am about to make entry into another pharma scrip, after i reduced suven…
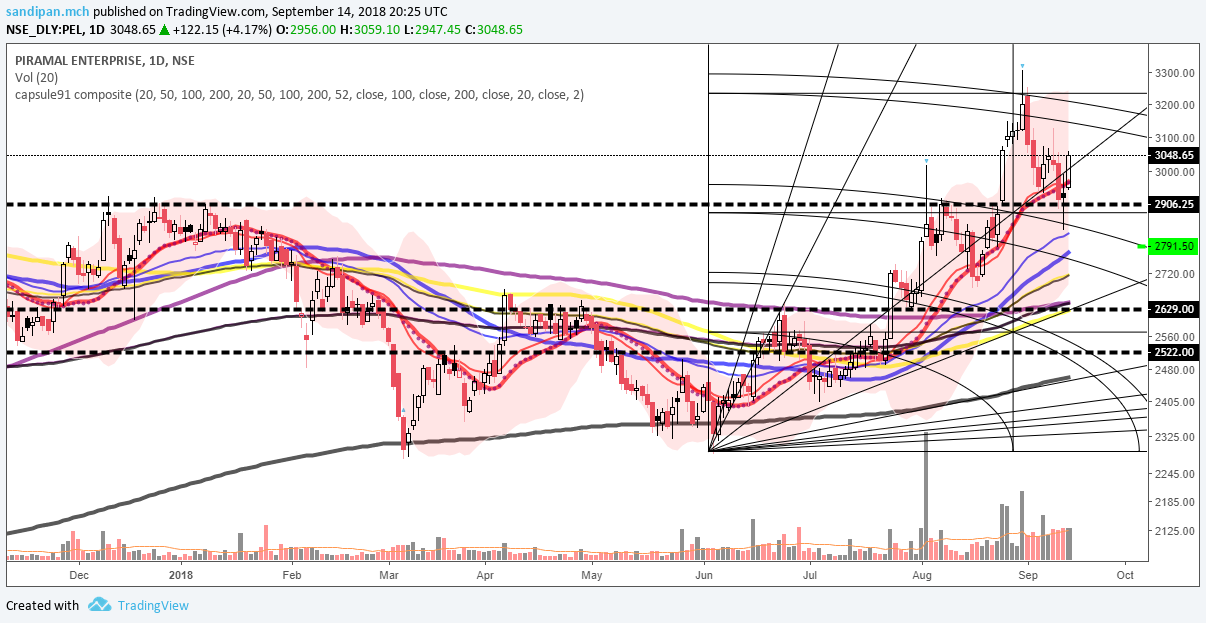
the gann box helped a lot in nailing the temporary top…
my exit was 335, on the second approach , after 337 was the high made…
will reenter / add later, this scrip needs to cool down a bit…
meanwhile, taking the help of technicals, have sorted down to alembic pharma, aarti drugs, more of torrent pharma, more of piramal, natco pharma…
using simple bollinger bands…
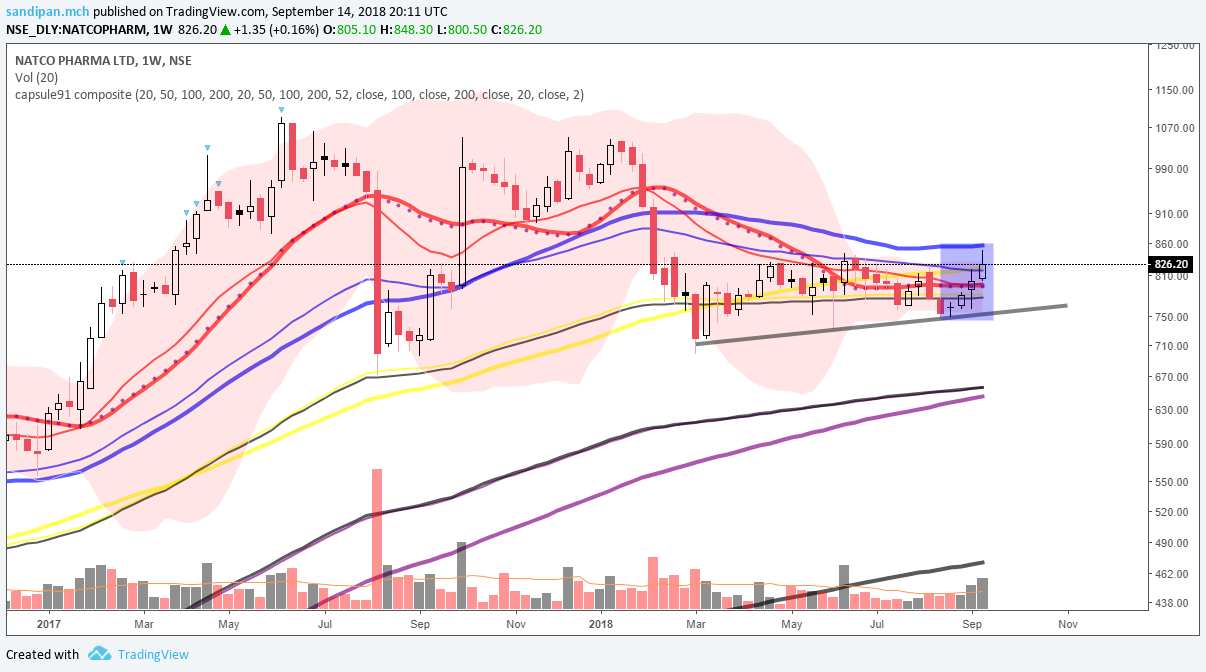
natco’s band is compressed in the weekly chart
[shown above]
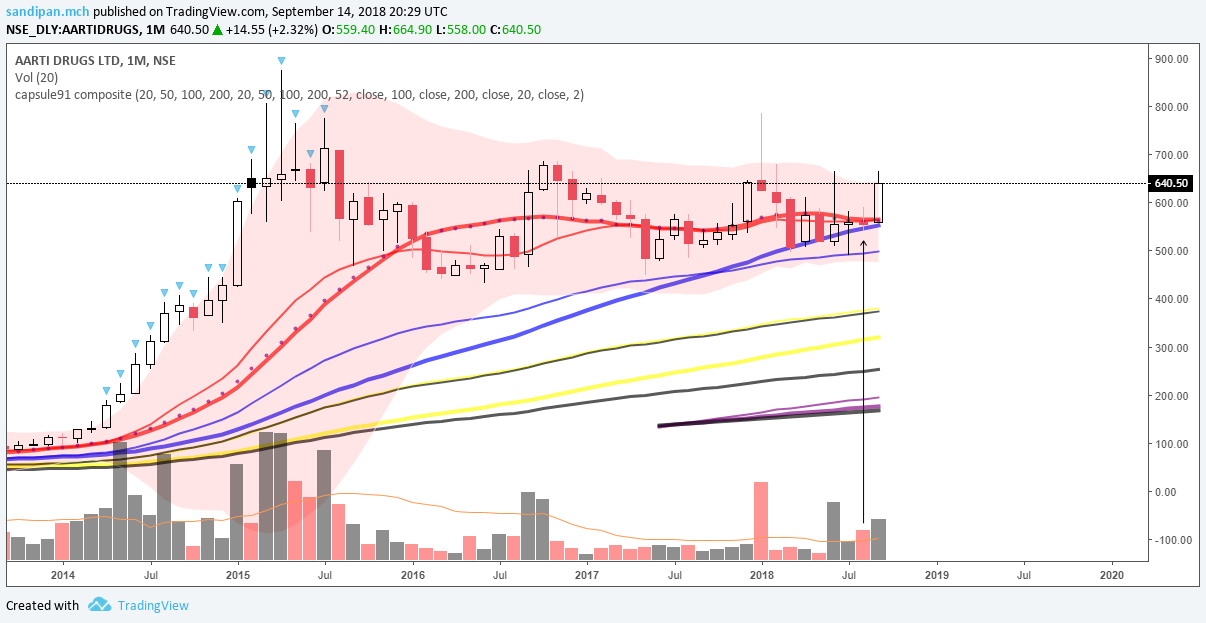
and aarti’s bands are compressed in the monthy chart…after that small spread candles in high volumes, its likely all the supply has been absorbed, a show of strength is likely
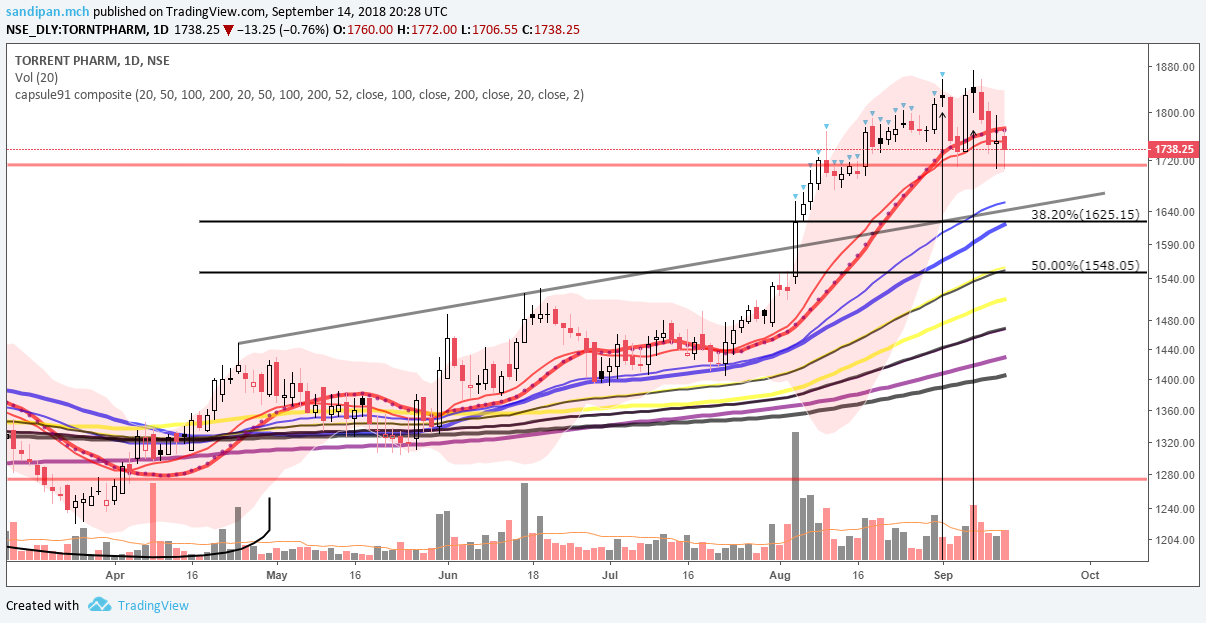
torrent has shown the show of strength in phase c, face 2 climactic stops, and its evident it might not move unless, it shakes some weak hands out, will be interesting to watch the fib levels
piramal is in phase d very last part, where it tested top of the trading range again and got a good response today , wont have much hesitation to add now, this might be a b wave of abc correction , if it goes down further in c wave, will add more… if not will average up again…
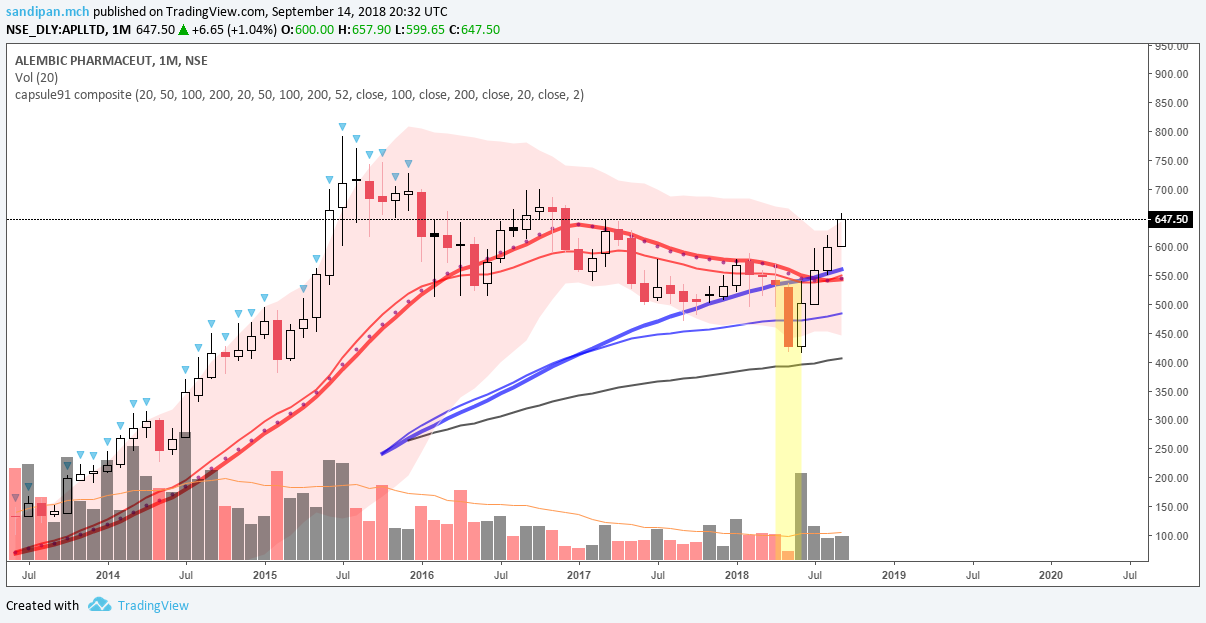
alembic’s bands have openned up acros all time frames, and also the concerns regarding the trend i mentioned a couple of posts earlier, just technically
to a conclusion, my preference would be piramal>natco>aarti>alembic>torrent>suven, in terms of timing the market…
but i would go out there and take aarti drugs first, as a literal breakout hasnt happened yet , and i can buy low, as i am having a positive bias on this structure…
i will avoid natco, as i see 2 big distributions happend, earlier, and the resultant true accumulation base is smaller …
torrent has been the discussion multiple times, in previous posts, so nothing more to add, both technically and fundamentally
disclaimer… completely biased picture… and i am not an expert or something, just sharing my technical thoughts and judgement, criticism requested
i am inclined towards pharma as a sector, now, specially because, the sector, has gone against the headline index in this correction, [what ever the fundamental reasons may be, not bringing in the POV], show the relative strength, and the stock is in strong hands now…
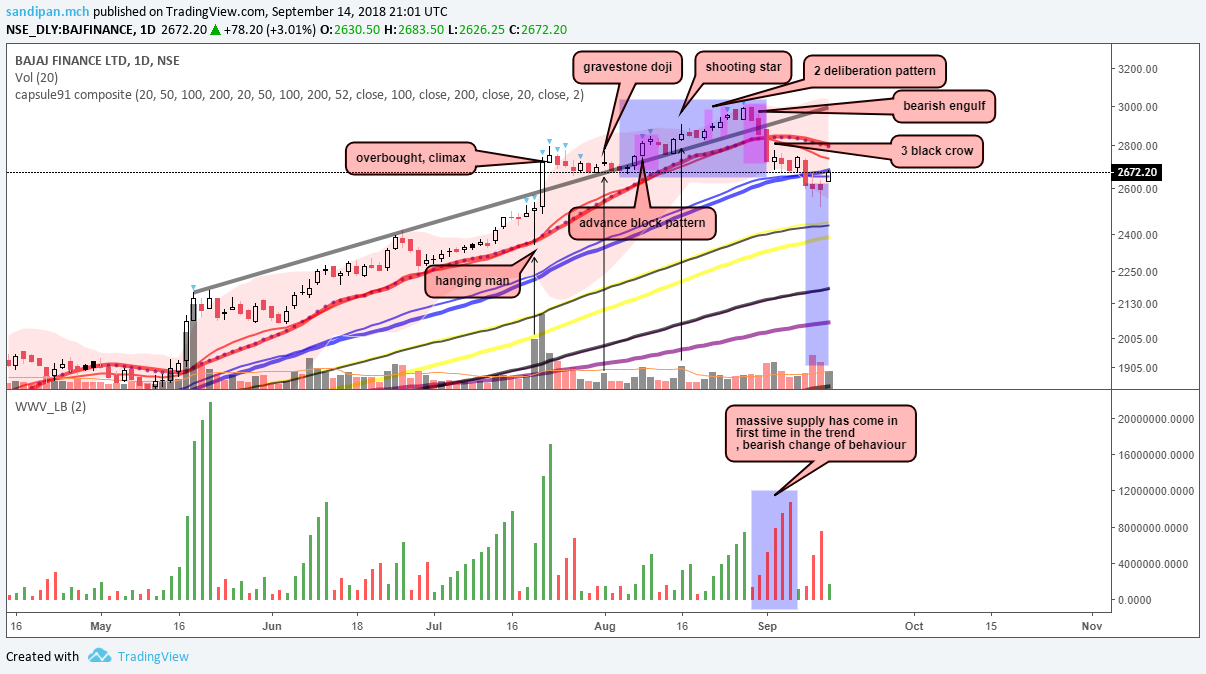
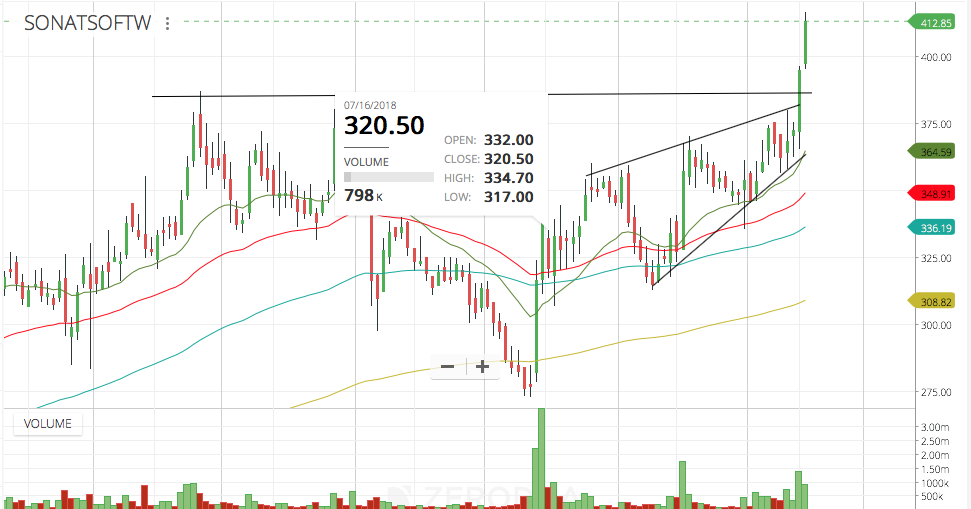
[hanging man/dragonfly doji]
the last part of the rally, marked in blue, was on ridiculous lack of demand, typical of an upthrust…
this trend has reached climax, a reattempt to test the reverse trendline/bollinger band is likely after the downtrendline has been broken today, and the last 2 days high volume small spread candles unable to progress downwards suggest some buying the dip happening, but the trend has broken, thats all what i can say now in this thread…
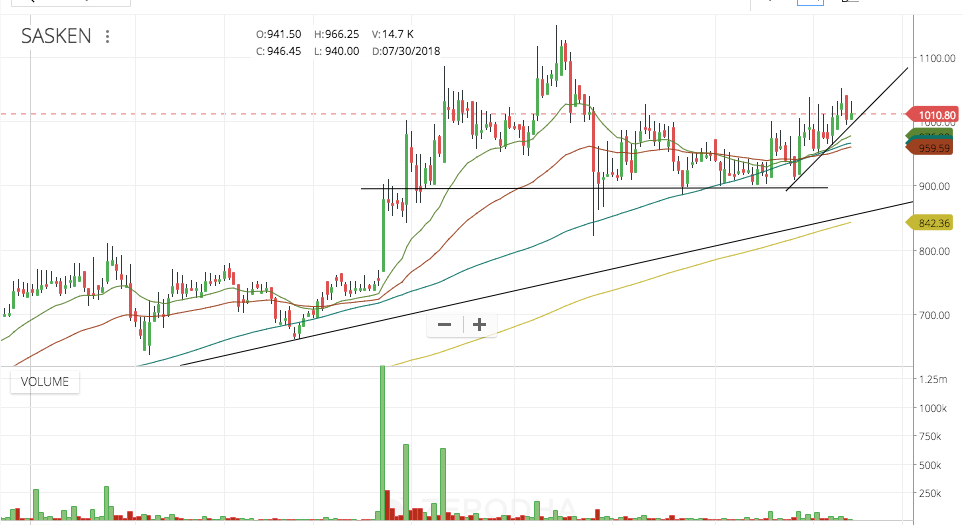
Sasken update - The daily is holding on to the upwards trendline so far this week. The supply seems to have exhausted considering this flat trend consolidation between 900-1000 has been going on since April. Now its consistently trading and closing above 1000 on the daily, since the last time I posted around 980 levels where it was making attempts to do so.
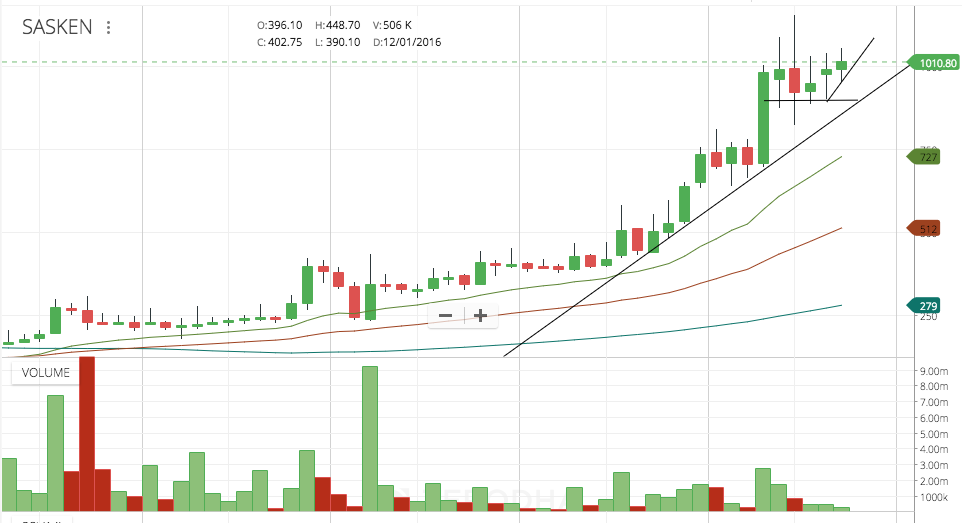
The bigger picture is the monthly - If it closes above 1000 this month, it could be the highest monthly close in 6 months, paving the way for further uptrend. There are three green candles as well on the monthly showing a rising consolidation (notice dwindling volumes on account of supply drying up). The previous big move in April (which came after a 4 month consolidation as well) negated good results in July and caused a consolidation to continue. Results could come in around a month’s time now and this appears set for a breakout. At 18 P/E, they are on the higher end of their historical P/E but they appear to be showing growth this time around which is good. Cash rich balance sheet and shareholding friendly management is good too. Played a similar techno-funda bet in Nucleus software which worked out well. Hopefully, this one will work out too.
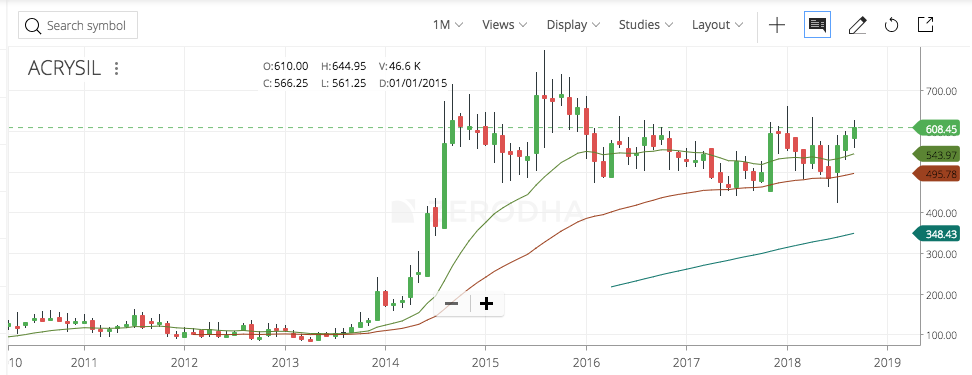
Acrysil update - The big picture is very promising. This month if it closes above 600 will be the highest monthly close since 2015! Three green monthly candles is promising too.
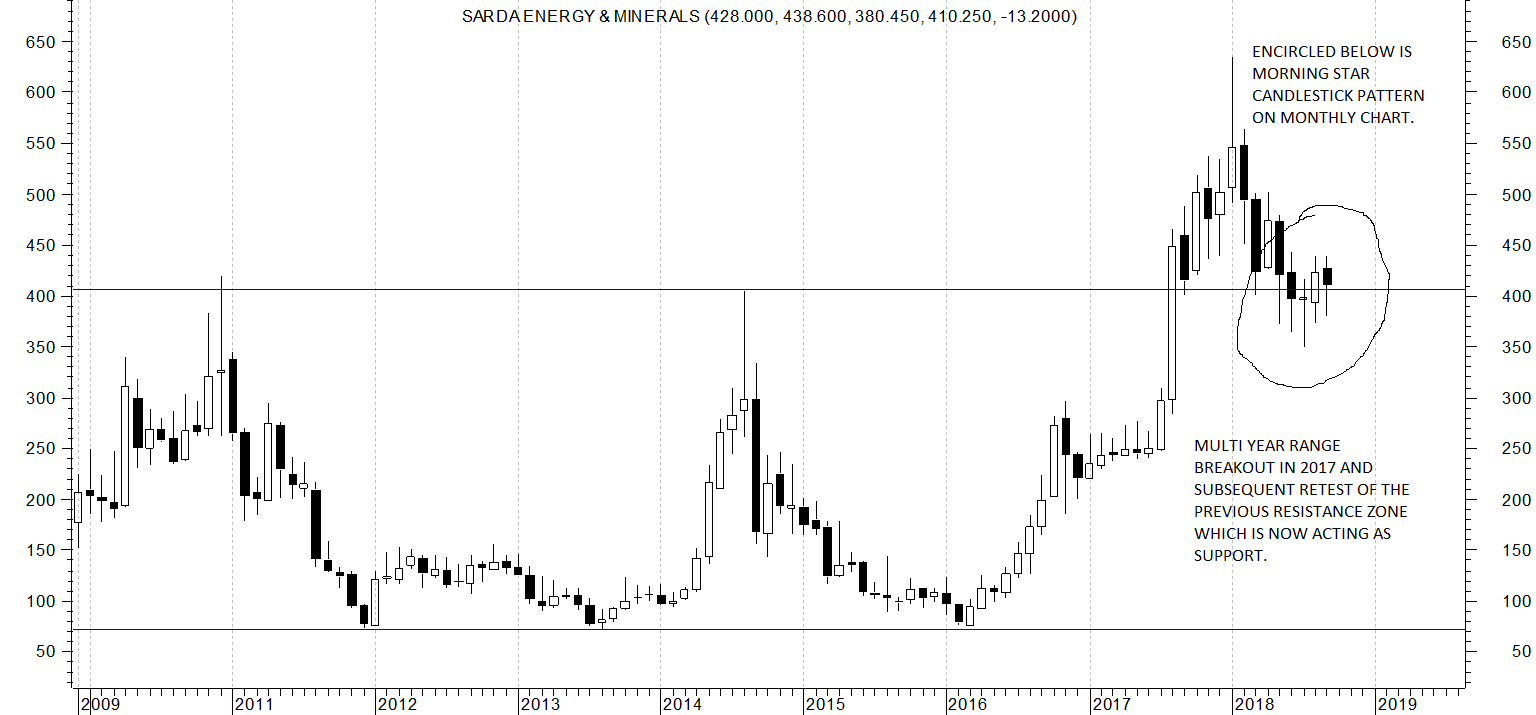
Sarda energy chart is a classical multi year breakout chart. The monthly chart shows following characteristics.
Breakout from its multiyear highs of 2010 and 2014 and stock posted a high of 635 as it usually happens on strong breakouts. Usually one can hope for 30-50% immediate pop up if the breakout is not a false one.
Now with recent small-midcap correction the stock price corrected and came down to test the earlier resistance which now acts as a support as per the change of polarity principle.
The resistance zone earlier was around 400 and since a shakeout happens usually before a big move the stock price went down to post a low of 350 where I think all the weaker hands were shaken out.
Post the shakeout there is usually a consolidation within a tight range which is now happening in a range of 370 to 430.
In this process the monthly chart shows the formation of a morning star candle stick shown in the circle. Here there is a bear candle in first candlestick (monthly candlestick here) followed by a doji (indecisive candlestick where price opens and closes at same level) in the second candlestick. And the third candlestick is a bullish candlestick which covers the body of the first candlestick. In effect all the selling is practically absorbed in these 3 months.
Now the question is what is the best level to buy this stock? Ideally it is when there is a strong volume based breakout and stock price closes above the recent high of around 430-438.
disc: no positions. Since this chart contained a lot of classical characteristics I have posted it here.
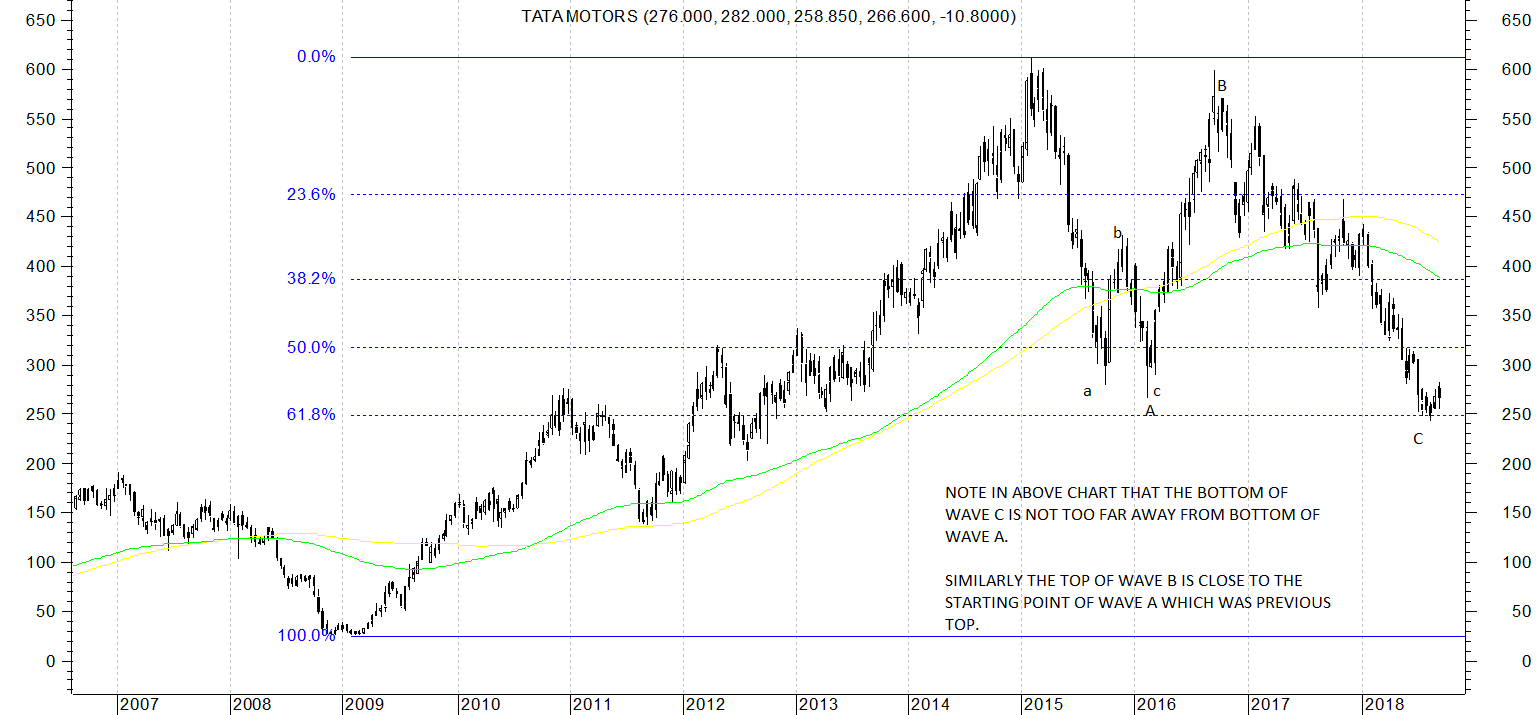
Tata Motors chart is an interesting chart according to Elliot Wave theory. Here’s what Ramky Ramkrishna mentions in his book Five waves to financial freedom about Simple corrections -Flats.
A flat correction is a horizontal correction that occurs between two impulses. Like all corrections this wave also is made of 3 waves. The wave A in a flat is made up of just 3 waves. This by itself signals a lack of strength to correct deeply the prior impulse wave. Wave B inherits some of this characteristic and ends near the start of Wave A and unfolds in 3 sub waves. Once B is completed the Ensuing C unfolds in 5 subwaves but once again unlike wave C of a zigzag this wave C will finish at or just beyond the terminal point of Wave A.
The most important clue from the preceding paragraph is when you see a move back to the start of an initial 3 wave correction you should get in the habit of labeling it as a flat correction. This would mean the end of Wave C is unlikely to go much beyond the bottom of Wave A.
With the above information provided in the book if we try to apply this knowledge to the chart of Tata Motors, we can see that Wave A was a 3 wave affair labelled in the attached chart and went from 612 down to 265 a distance of 347 points.
Then wave B went up from 265 to 598 which is just below the high of the start of wave A which was 612. distance was 333 points.
Then wave C went down from 598 to a low of 243 which is a distance of 355 points. Now it seems to be showing some signs of stabilising by not revisiting lows of 243 and a small but bull candlestick last month. All this happened at exactly 61.8% retracement of the whole previous upmove from a low of 26 in Jan 2009 to a high of 612 in Feb 2015.
If it were to turn and change is trend the current level seems to be a good level to turn up. Lets see how it plays out.
disc: took a small starter position to test the hypothesis.
And given the symmetry of amplitudes, would the period again be close to 2-2.5 years for a 100% from hereon? That time frame kind of matches the expected returns from the ongoing investments in JLR.
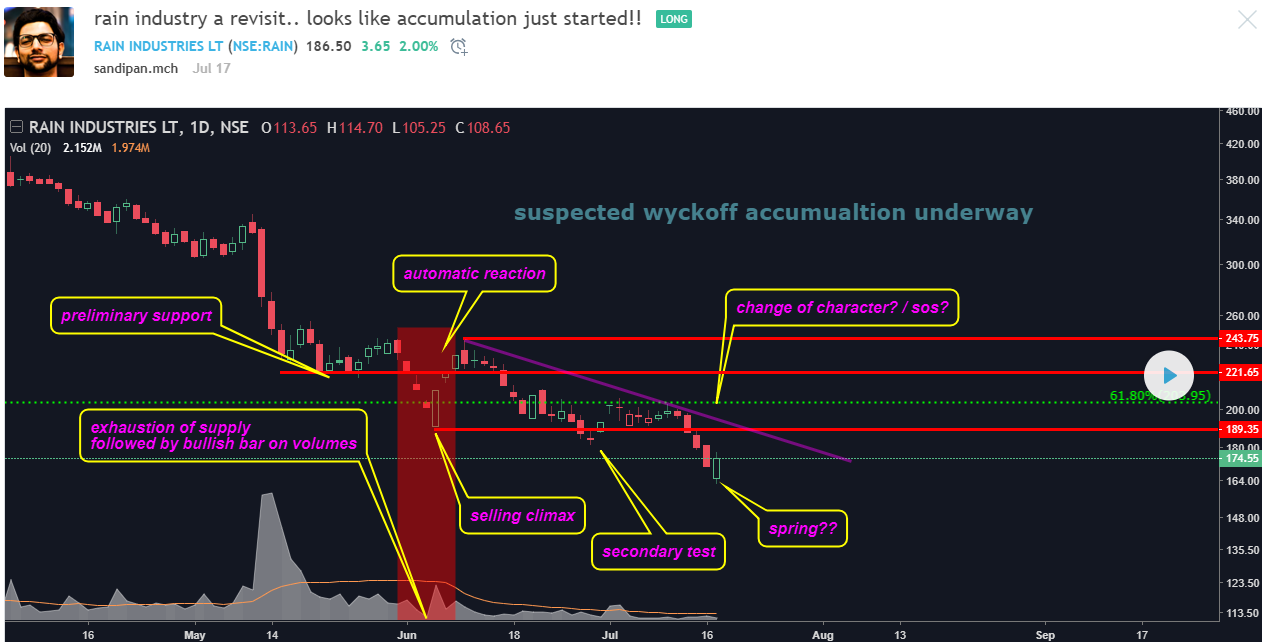
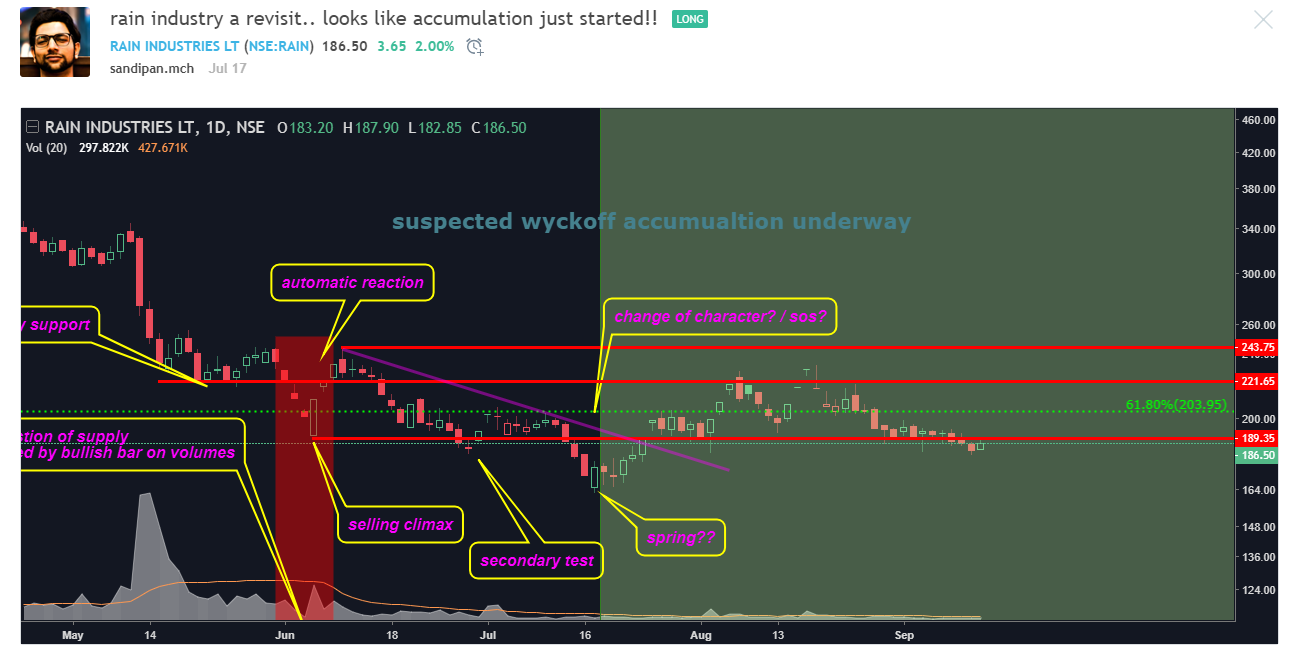
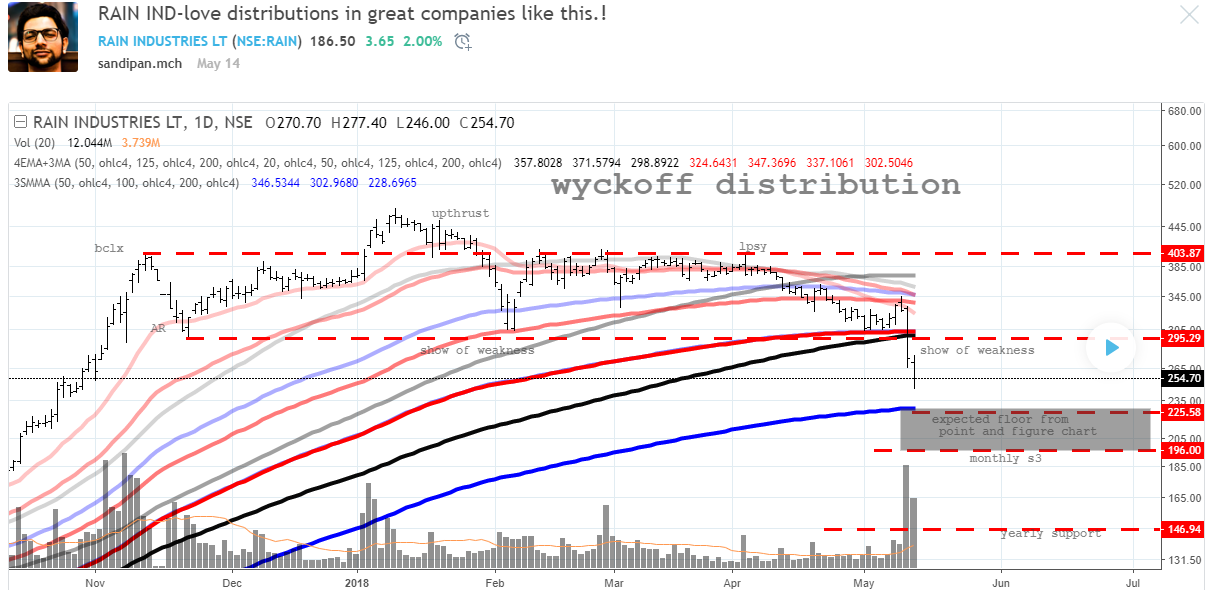
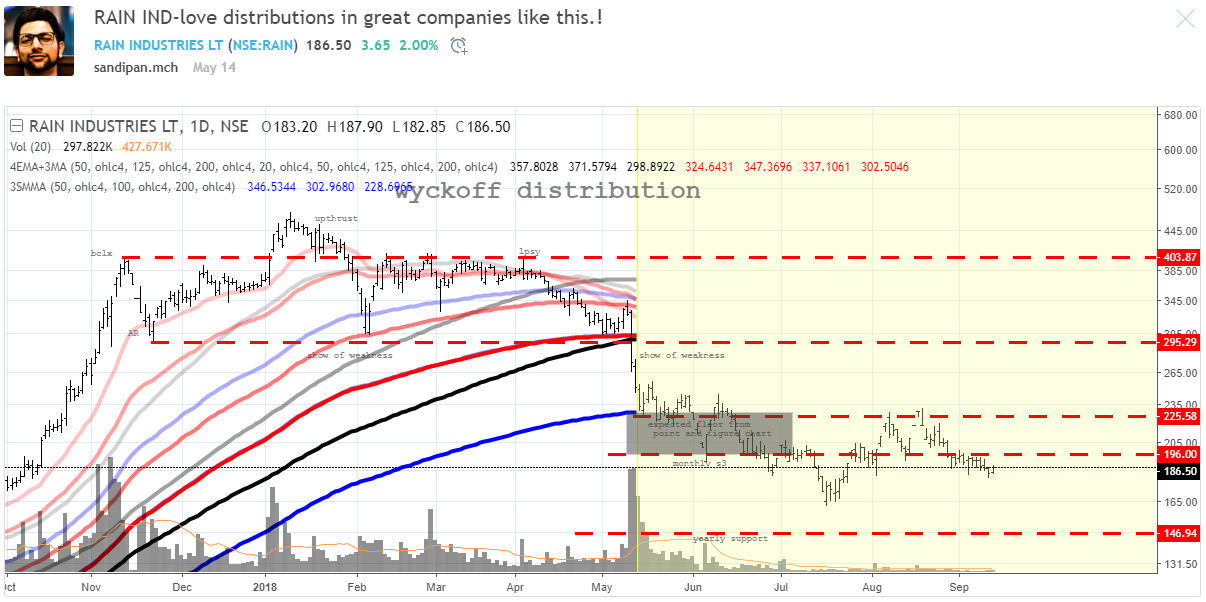
rain industry seems to be accumulating fine so far…
real change of character is awaited still…
the theory will be tested if 225 plus closing happens on good candle or support is taken form there in coming times…
having said that, there seem to be a lot of inertia at the top, a number of shakeouts are expected , a very long sideways action might be the case looking at the cadles we got at the top, and also take note of the presence of the yearly support at 146, which has not been tested yet
minor spring action broke the down trendline inside the trading range
rotation region as marked in grey , from the point and figure chart, seems to be working fine as a testing ground as expected form the distribution theory at the top
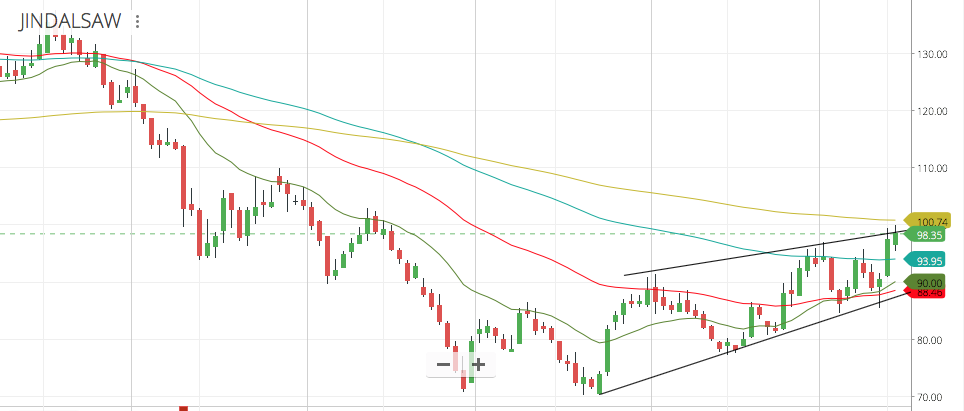
Jindal Saw - Looks to be coming out of the downtrend, consolidating in a rising wedge. If it breaks out of the wedge and closes above 200 DMA, could pullback to past highs.
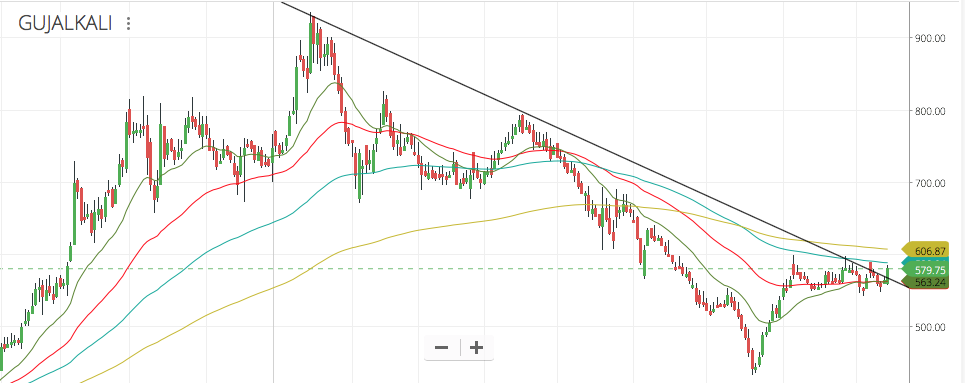
While the focus seems to be on sugar stocks, quite a few commodity chemical stocks which are benefiting from China’s env policies are having a run that’s similar to what Graphite India and HEG had. There are too many stocks in this space but it looks like the more hazardous the chemicals involved, the bigger the margins the Indian micro-cap companies seem to be having in recent quarters - be in Chlorine, Fluorine, Nitrochems etc. Interesting times!
some big money again came in to accumulate acrysil today…
and we needed that mid 600 zone sellers to be removed from the system…
this gets interesting…
the volume has been tremendous, its 1 year average volume is 4,600 share transaction per day…
today there were about 26,000 shares transacted in just 5 mins…
highest since march this year, when ashish kacholia had made entry…
this volume is higher than the time, when vijaya s is suspected to have made [part of]entry on 13th june