Thank you very much for the recommendation
Thank you very much for the recommendation and link
@Agarwala You seem to have entered at the end of correction. To me, it looks like the ABC correction ended at 60.8. But you can’t say. It can be a complex Elliott Wave correction too. Only when waves develop, you can say. But in the long term, the chart looks bullish. Eventually the current wave (5) should cross the peak made by wave (3) at 98. Here’s a chart. It’s only my interpretation of chart. So, please make your own decision.
Hi @Agarwala , after a long time i guess…! how have u been?
Anyways, u made the best entry possible at daily pivot point in nalco …
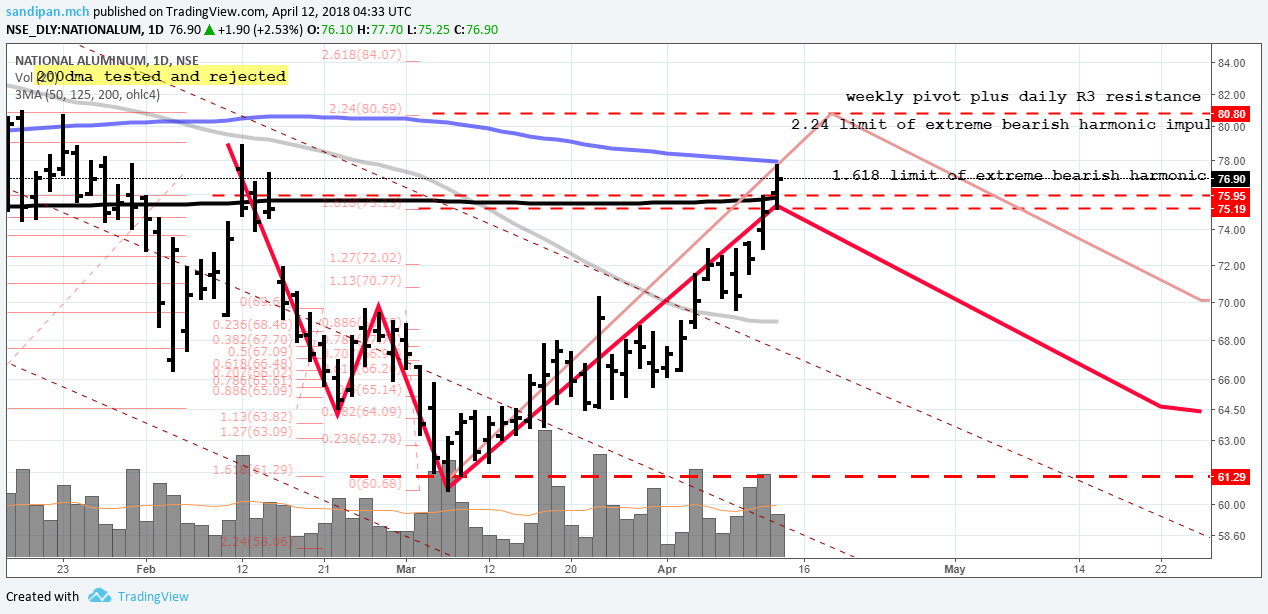
Its very likely the 200dma is going to be tested, it was tested before also after the release of Q3 numbers but was rejected to create a correction, the excellent dividend payout changed the market sentiments and a new impulse was created which is presently being followed …
Over all the recent structure looks bearish to me… if the 200dma test dosent get rejection, the weekly pivot a little higher up will be the nest resistance to test…
Partial profit booking might be a prudent risk management…
Here is the link to my chart projections…
Disclaimer… not invested/no trading active
Hi @Capsule91 and @PE_Ratio
Thanks for the feedback. The stock seems to be in momentum. I will hold it with a stop loss of 71. As suggested, I will book partial profit near 200DMA that is near 75.
I have a friend in Nalco who tells me that this year has been pretty good for them, both top and bottomlines. The Q4 results are going to be very good. My question is… would that influence the technicals?
@BullMoon What you’re saying (fundamentals) matches with my Elliott Wave prediction. It will continue to be bullish this year.
The technicals always follow fundamentals, unless the market hasnt priced in a good q4 yet…
The chart i posted is a shorter term daily one , which @Agarwala enquired upon…
The 200dma test is going to be a decision maker…
If i look back on the technicals a bit, the 200dma was supporting the price almost the whole bull run of 2017, but since august, a bubble formation started, a massive head and shoulder pattern started forming which 200dma as the base neck line, after it broke that support , this was retested and establised ad a resistance… Now i find a bearish structure forming in the present daily charts which is a continuation pattern of the head and shoulder…
Any break off of 80.8 upwards is going to totally destroy the bearish pattern and a new trend will be established upwards, which is where @PE_Ratio’s bullish analysis joins hand…
Otherwise it might consolidate accumulate a bit at the dma before the next upmove which lines with the fundamentals…
How the dma is going to react this time will tell further answers, and the broader market seems to be rcovering well…
@Capsule91 Hi, I was following this thread since inception.Hence requesting you to keep posting all of your findings of various chart patterns after recent correction
Is NALCO ready for a breakout?
@Capsule91, @PE_Ratio, @BullMoon, @The_Confused_Consult. I am expecting a major move in NALCO and holding my position. Please give your perspectives. There are some recent developments.
The following article will give us a perspective on rise in Aluminium and Alumina prices.
Why U.S. Sanctions On Rusal Will Benefit Indian Aluminium Producers
Also see the video on CNBC TV 18 of TK Chand
This is fractals chart of NALCO
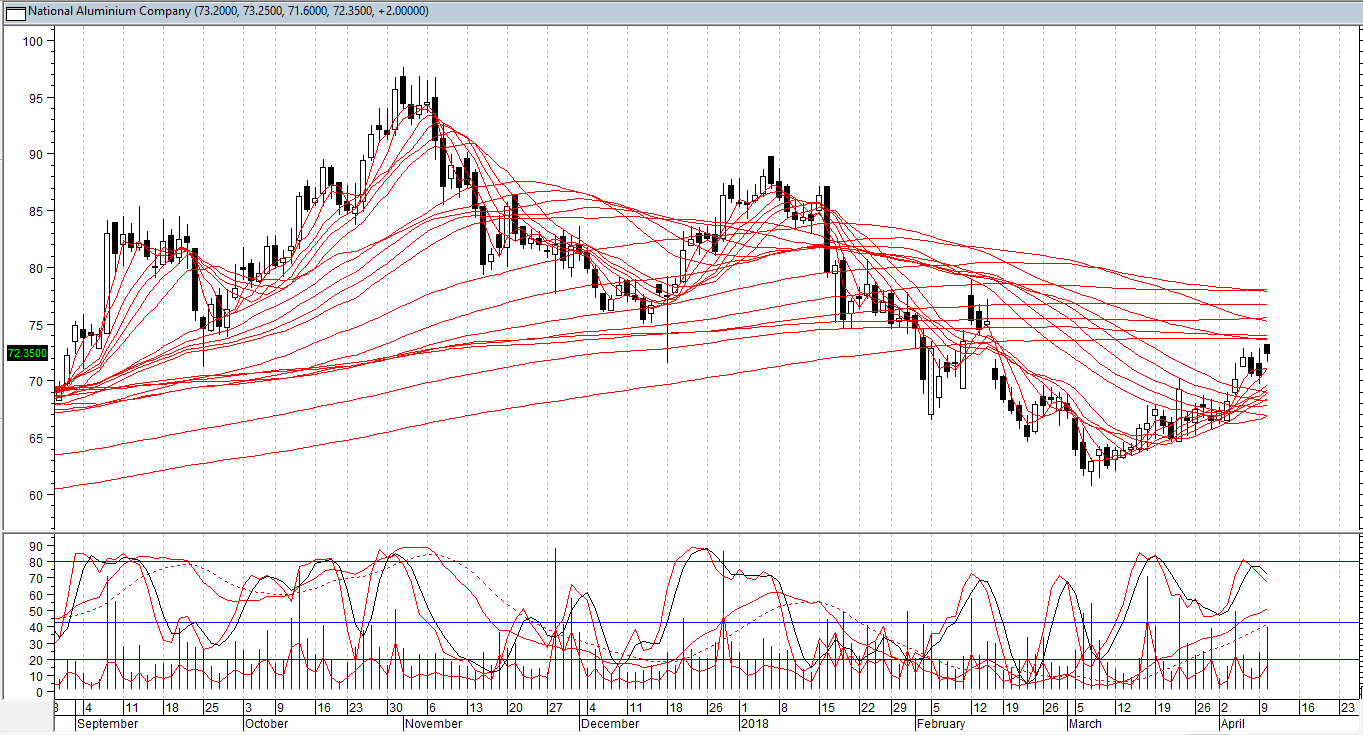
the 200dma (marked in dark black) was smashed with stellar volumes and spread on advance…
But on lower volumes than last time…
With the 125dma as the next resistance(marked in blue) it will be an interesting sight to see…
All the best to you…
I am neutral to bearish as of now…
A breakout above 80 is a true breakout to me
@Agarwala If I go by the EW chart I posted, I’d be bullish in the midterm. And the price movement is according to my wave interpretation. Let’s see.
@Agarwala I would be lying if I say that I understand much of technical analysis. Perhaps the best out of tech analysis for me is to enter a fundamentally sound stock at a decent valuation. Nalco is one of the lowest cost producers of Al. It has huge bauxite reserves in Odisha and Andhra borders. The cash and reserve position is good. It’s efficiency numbers are not as great as it could have been (it after all is a PSU).
I am told that the Alumina production has gone up this time, with a marginal increase in per ton selling price (alumina is the powder derived from bauxite, and is the feed for Al production). Overall Al demand is for a positive swing.
The point I want to make is… This certainly is not a mutibagger. But, downside is not there. Again, momentum kind of quick buck opportunity is lost. I still wonder how did it go to 92 (unless market thought of rerating it), and fell so hard.
If it climbs slow, I will continue holding it. If it rises 50% in a month, I would find that inorganic.
Thanks @BullMoon, @PE_Ratio, and @Capsule91 for your invaluable feedback. With aluminium futures breaking above $2300 and still moving upwards, and with Vedenta boss Anil Agrawal predicting a price range of $2500 to $3000—it seems that aluminium companies are in for a long profitable haul. Chart of Aluminium futures can be accessed here . . .
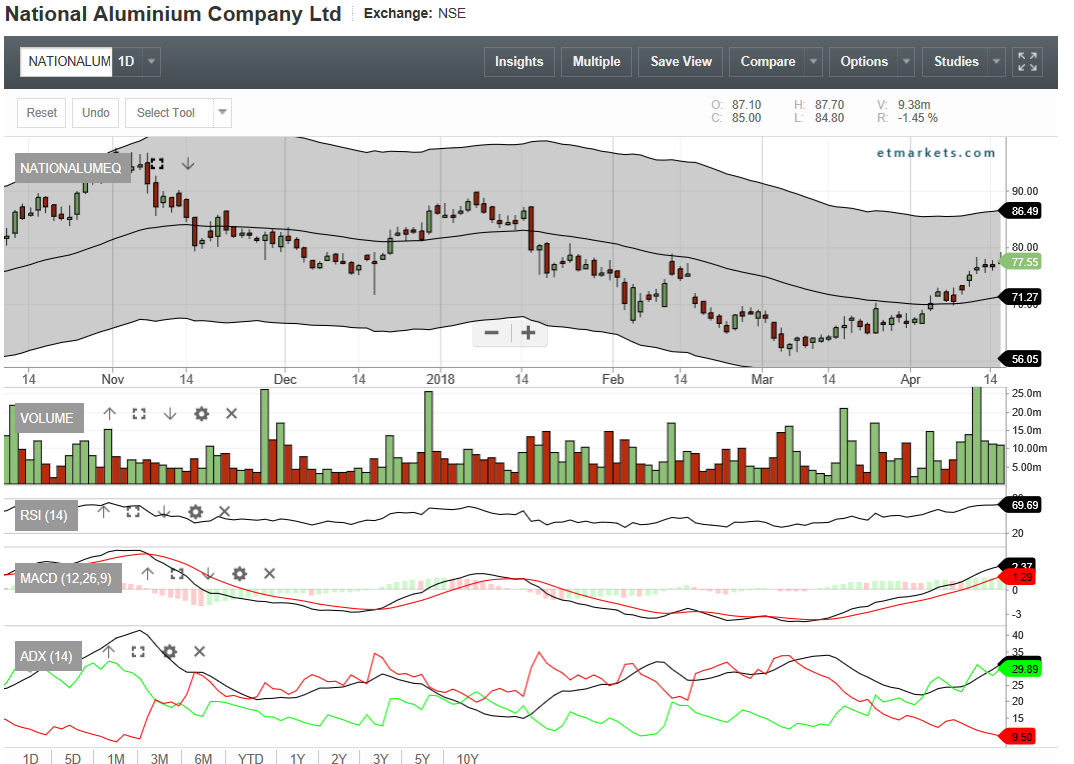
Keltner Channel suggest that there will be temporarirly upward movment may be for another one week but than it will break out for bearish trend
Volume also suggest that there will be break of treand This is from my own experience when there is abnornal volume turnovere the more chances are of break out of Price momentum one can refere to Yahoo Search - Web Search
RSI is showing the stock is about to touch the overpurchase which i learn is about 80 than the people will start unloading the quantities which is not a good sign
MACD and ADX are giving strong signals for upward movment .
Conclusion : true break out will be if price goes beyond 82
disc : not holding any quantity of stock
Hi,
Here is the chart of williams AD line as of today (17/04/2018) closing
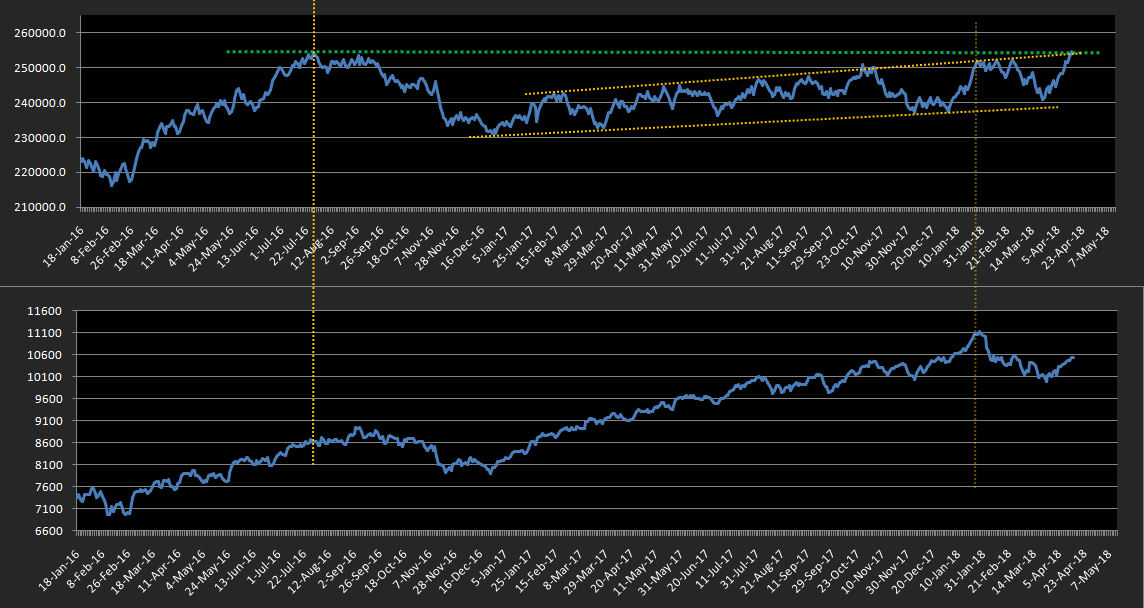
The accumulation level has just crossed the 2016 august high levels. Lets see whether it sustains above this level. If the above study is correct http://forum.valuepickr.com/t/bull-therapy-101-cup-and-handle-harmonics-other-breakout/16338/175V, then we might have entered into new bull phase…
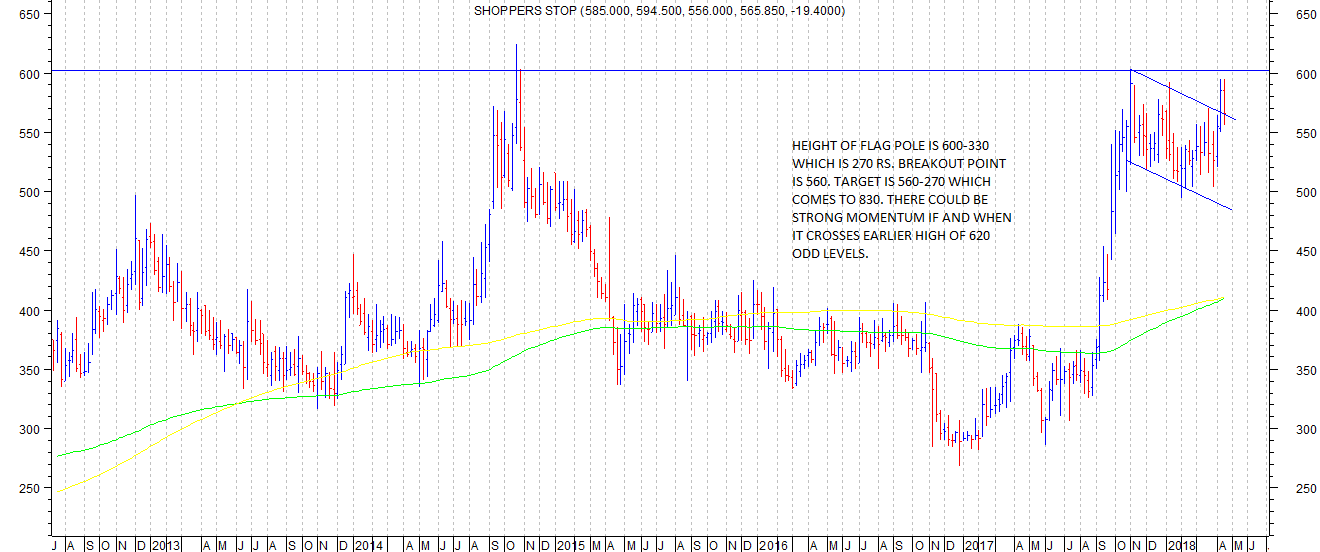
Shoppers stop is forming an interesting chart pattern esp on weekly chart as shown in attached chart.
Its very close to its all time high and forming a base below the previous top level. This base is taking the form of a flag pattern. A breakout also seems to have happened from the flag pattern but volume spike is missing. There are two ways to play this pattern if one wants to play it. First is to buy around 550-565 levels and keep an appropriate stop loss according to one’s comfort. Ideal is somewhere around 530-540. The other option is to wait for stock price to breakout above 600-620 range with volumes and take a position. Targets in both instances could be close to 750-800.
Fundamentally some developments at company level have taken place.
The loss making hypermart division has been sold off to Future group. That should limit losses.
Amazon has taken stake of 5% in the company by infusing around 191 crores.
Company has been consistently reducing debt and is likely to be debt free in next few quarters.
Disc: invested