
Coromandel…
continuation post and swing update
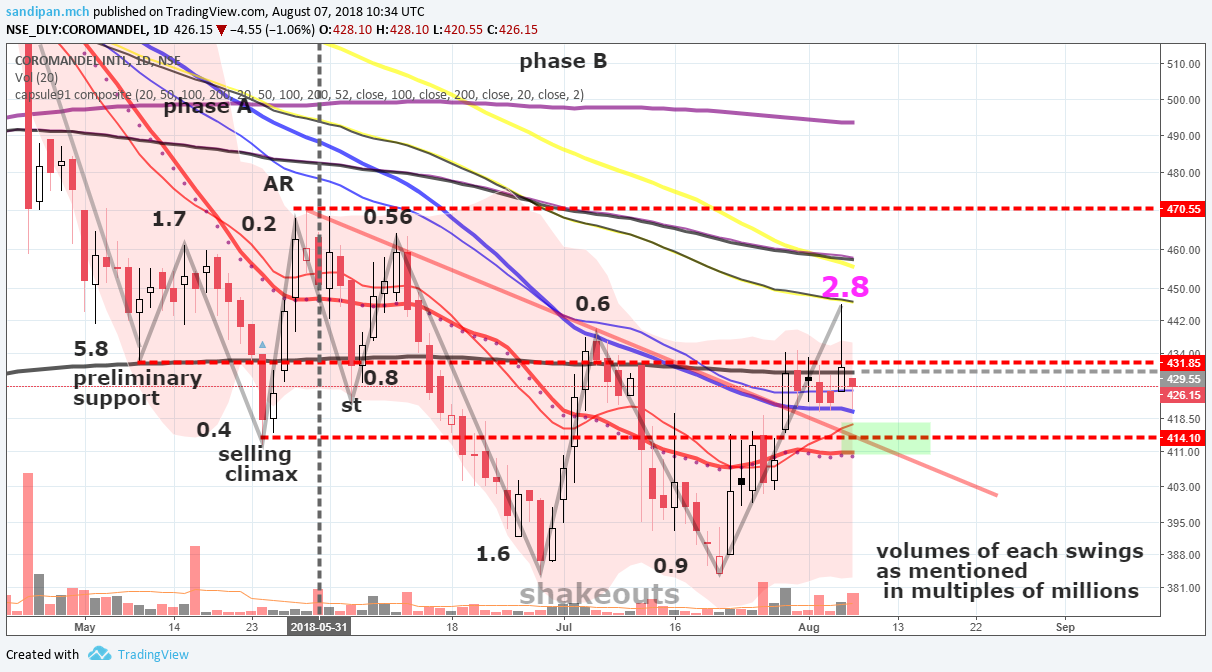
the last upswing was on massive volume surge , 2.8 million shares were transacted…
this is highest in the schematics since the prelim support which was o 5.8 million…
talking about levels here, the chart is a bit messy though, with all the possible moving averages and bollinger band clubbed into a single indicator , here the blue MA is are the 50 week sma nd ema, which is acting as a support, today the high volume candle was a hammer with test at 50 day sma…
to me it looks like the 50dma will agian be tested on lower volumes and since the 50dma is curving down looks like will nearly intersect with the 20ema median line of the bollinger bad[marked with dotts n red combo] and the red 20day ema, so the market green region rest, looks likely…
if the volumes on this downswing dries off, lesser than any of the shakeout volumes [1.6 and 0.9 million], this can be a last point of support [lower, generally 2 lps forms one lower and one higher in the trading range , separated by the creek, which is presently the 200day wilder moving average at 429, the line of biggest resistance]…
the schematics is still in phase b, with high probability of jump into phase d…
disclaimer… watching, no positions taken yet