
@devaki.tripathy very nice observation…
clearly the action climbed up the moving average , backed up and tested supply, and then continued with the trend… this behaviour is itself bullish, specially today’s candle was a nice marubozu with minimum upwick, demand was definitely in control…
looking at the weekly chart…
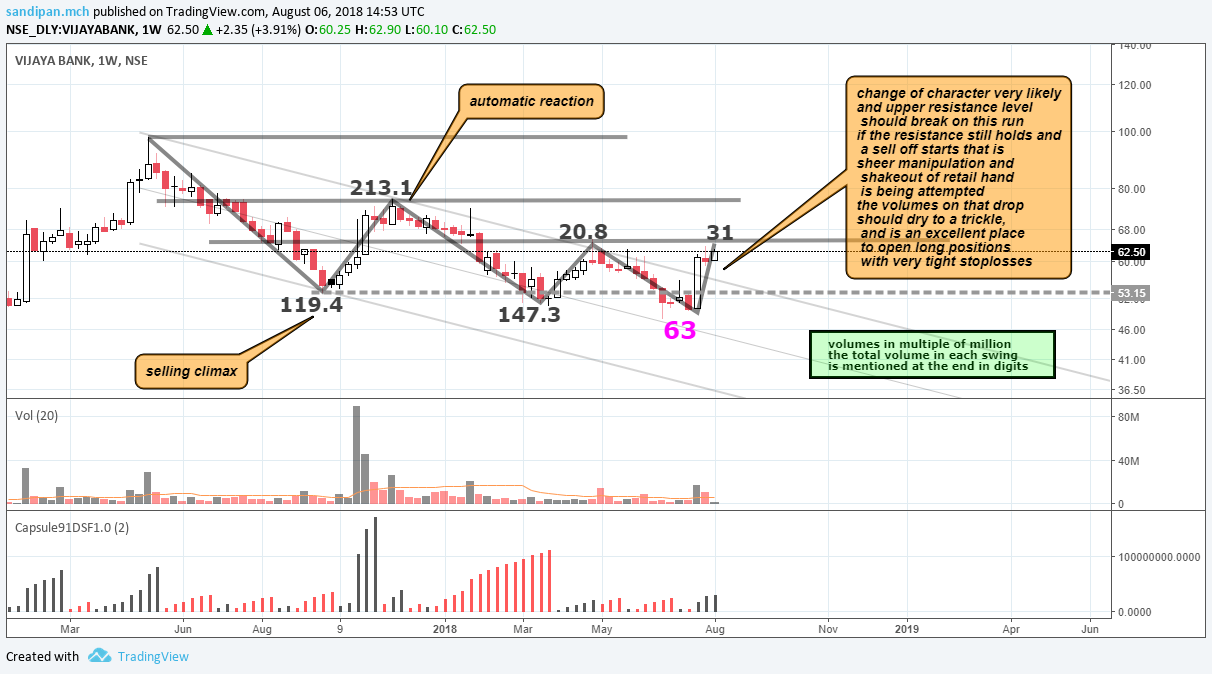
there is a downtrend channel we see, and the rallies repeatedly failing to even test the prior highs…
3 things here…
- there was a selling climax which was followed by a rally, on good volumes and a change of character
- what happened next was another decline on even higher volumes of 147.3 million shares compared to 119 million ont he prior downswing, but the price hardly made new low below the climax… lots of effort, no result… this is the first bullish sign in the chart…
3.the next decline, was on just 63 million share transaction… at the conclusion of which a big bullish bar…
to me this looks like the supply has been absorbed/ in the process of absorption…
and a change of character on this rally, will be seen, if not, it sud go as i mentioned in the chart…
if i am to take a trade, i would watch for a change of character and then a decline and the selling pressure on that, that would form the last point of support… which is the phase d of wyckoff accumualtion schematics…
hope this helps…
disclaimer… not invested