
Madhavi, Sometime promoter buying gives confidence…but why you think they are not releasing their pledged shares? i think that will give much more confidence right…which in turn will reduce the interest costs as well
could be promotor be buying his shares to maintain the share price as a major part of his holding is pledged and in case the market price comes down below a certain limit, he may either gets a margin calls or the pledger may sell the shares in the market bringing a crisis for the promotor? just a thought being shared for views from seasoned boarders and get benefitted with their experienced views
Plus the number of shares bought is quite small which wouldn’t move the needle for them. I would consider this more as a way to create positive sentiment in the stock when the share price is under stress.
Disclosure - hold tracking position. Booked profits at close to the current share price
1 Like
I don’t have exact amount but shares were pledged at quite less value than current market price as its old. So promoters don’t have to shell out lot of money to release them. Its just they want to buy more than releasing pledge. It’s totally my understanding and can be a biased view as I’m invested currently.
Balance sheet deleveraged as on which date?
As on 30 Sep 2017, it deteriorated.
I have exited my positions in BEPL because of LTCG related issues, and because I feel that the market is now flush with better opportunities. I may decide to enter BEPL at a later date again, and I feel that the story remains intact.
2 Likes
Upper circuit again at 169. Looks this is consolidating at 165/175 range.
Were there any shares un-pledged?
Where to see the information on pledging of shares and at what value the shares were pledged?
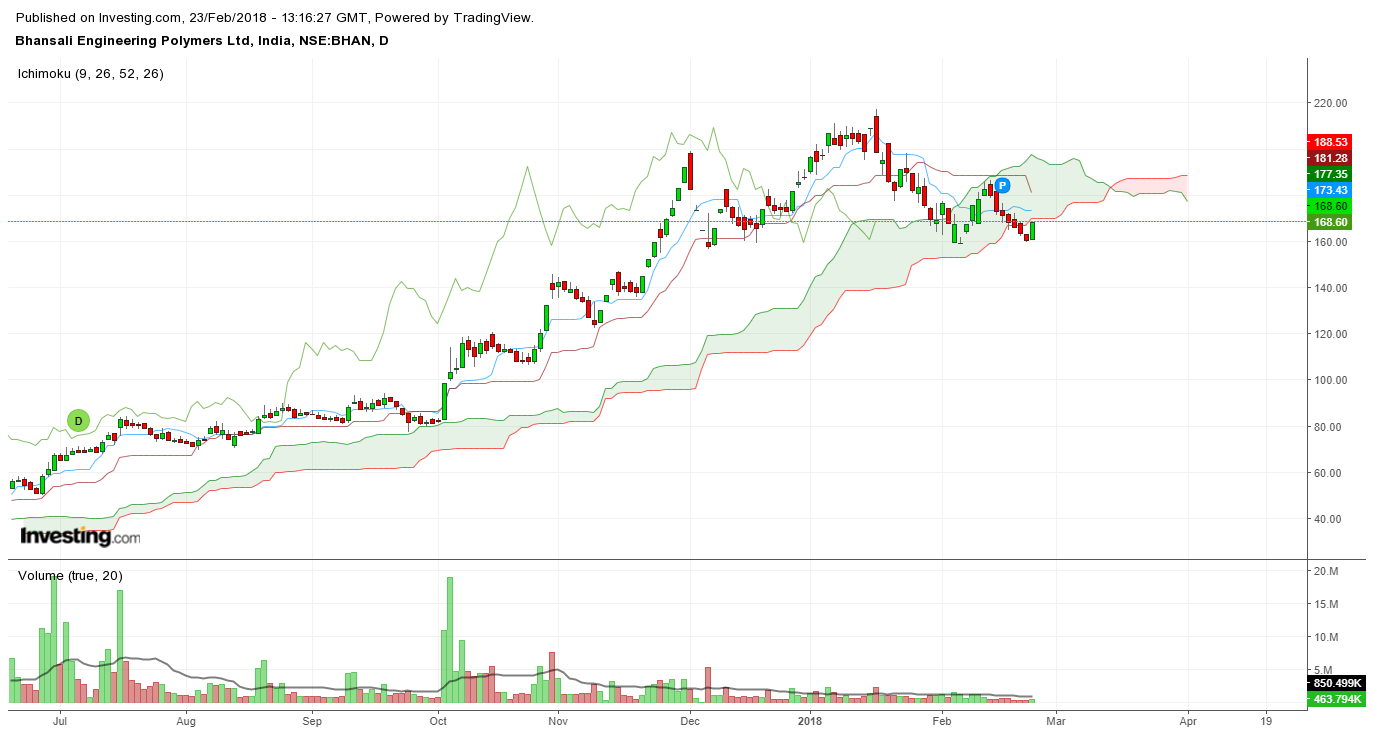
Cloud acts as a resistance and support for the prices. More the thickness of the cloud, lesser are the chances of prices penetrating the cloud. By this logic prices of BEPL penetrating the cloud in the near term are minimal, but this can happen in the second half of March.
2 Likes
BEPL in case one sees, the last 4 qtrs , Q-o-Q top line is continuously decreasing, in a commodity player, that is the 1st sign that Capacity is reaching its maximum utilization. This - I learnt from some of the Seasoned ones ![BEPL%20Top%20Line|690x81]
(upload://uE7Vwe4tPPtMKRary0IQHYlg9Qf.JPG)
That is why Mgmt changed earlier plan and went for immediate capacity expansion of 20K in Q4, 2017-18.
Net-net- Near term top line may see some muted growth.
Another key point, Operating profit is also declining, Q-o-Q % basis, that means it is not able to sell that much into Spot because of limited excess capacity. Check for last 4 Qtrs.
Please do your calculations. Comments welcome
Disc Not invested. Tracking closely
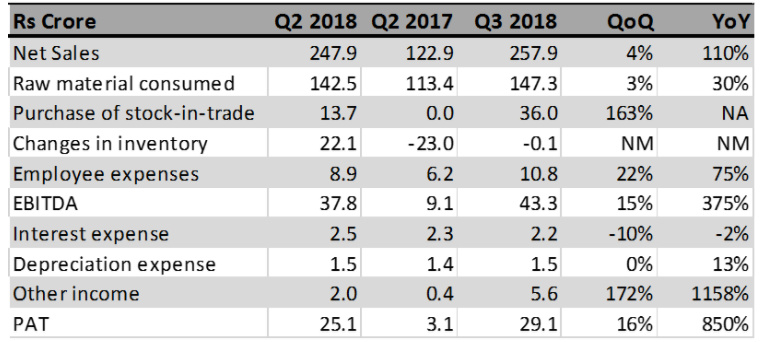
In Q3 FY18, BEPL posted net sales of Rs 258 crore, adjusted for both GST and excise duty, it was up 4% QoQ and 110% YoY. Improved turnover reflected higher pricing trend for ABS and the elevated capacity utilisation.
EBITDA margins improved sequentially by 154 bps (+938 bps YoY) on account of lower raw material cost (57.1% of net sales vs. 57.5% of sales in Q2 2018) and better realisations offsetting higher employee cost (22% QoQ). In addition, higher other income and moderate other expense helped net profit rise by 16% QoQ and 850% YoY.
Styrene/ABS pricing trend:
News flow suggests elevated ABS (Acrylonitrile butadiene styrene) prices from the Asian region to continue in first quarter of calendar 2018. European counters indicate that price quotes from the Asia region are not competitive as it used to be, historically, suggesting strong demand in China and India.
Recently, global major Trinseo has added new capacity of 75,000 MT in China. However, ICIS reports that a good part of new supply could be absorbed in China due to new regulations banning the import of scrap plastics and pollution crackdown.
In the near term, company is on course to increase capacity to 137,000 MT (from 80, 000 MT) involving capex of Rs 50 crore. As per the minutes of the recent Board meeting, it was confirmed that expansion would be complete by December 2018.
Further, the company expects that the greenfield expansion of 2lac TPA capacity would be commissioned earlier than expected i.e. by March FY 2021 vs. March FY 2022 previously anticipated.
We can therefore expect Bhansali to post earnings growth at a CAGR of 66% (FY 2017-20E).

The stock is currently trading at 21.8x FY 2020 earnings which prices in near term expansion plan.
Having said that, Bhansali with its green field expansion plan, is on course to become a dominant player in the domestic ABS market. Additionally, it is incurring a capex of Rs 20 crore for the R&D centre in Aburoad, which would be useful for customized and high margin variants of ABS applications.
Further, positive outlook for the end markets viz. Auto (50%) and consumer durables.
2 Likes
Mar 2017 June 2017 Sep 2017 Dec 2017
| Sales | 192.84 | 224.03 | 247.94 | 257.93 |
|---|---|---|---|---|
| Expenses | 170.92 | 194.49 | 210.13 | 214.62 |
| Operating Profit | 21.92 | 29.54 | 37.81 | 43.31 |
| OPM | 11.37 | 13.19 | 15.25 | 16.79 |
| Interest | 2.61 | 1.11 | 2.48 | 2.25 |
| Profit before tax | 24.33 | 27.73 | 35.84 | 45.07 |
| Net Profit | 5.06 | 16.88 | 25.10 | 29.06 |
It is seen from the above data Q-O-Q is increasing on all fromts Viz. Topline OPM,PBT and NP.
The above data is culled from Screener.
Can u pls tell a source where your stated data is given.
Rgds.
I have taken from Screener only but just check Q-o-Q % Change . Donot go by absolute numbers
Topline , 16.06217617 %,10.71428571 % and 4.032258065 % increase
Top line, Operating Profit and PAT …all are in decreasing trend % wise.
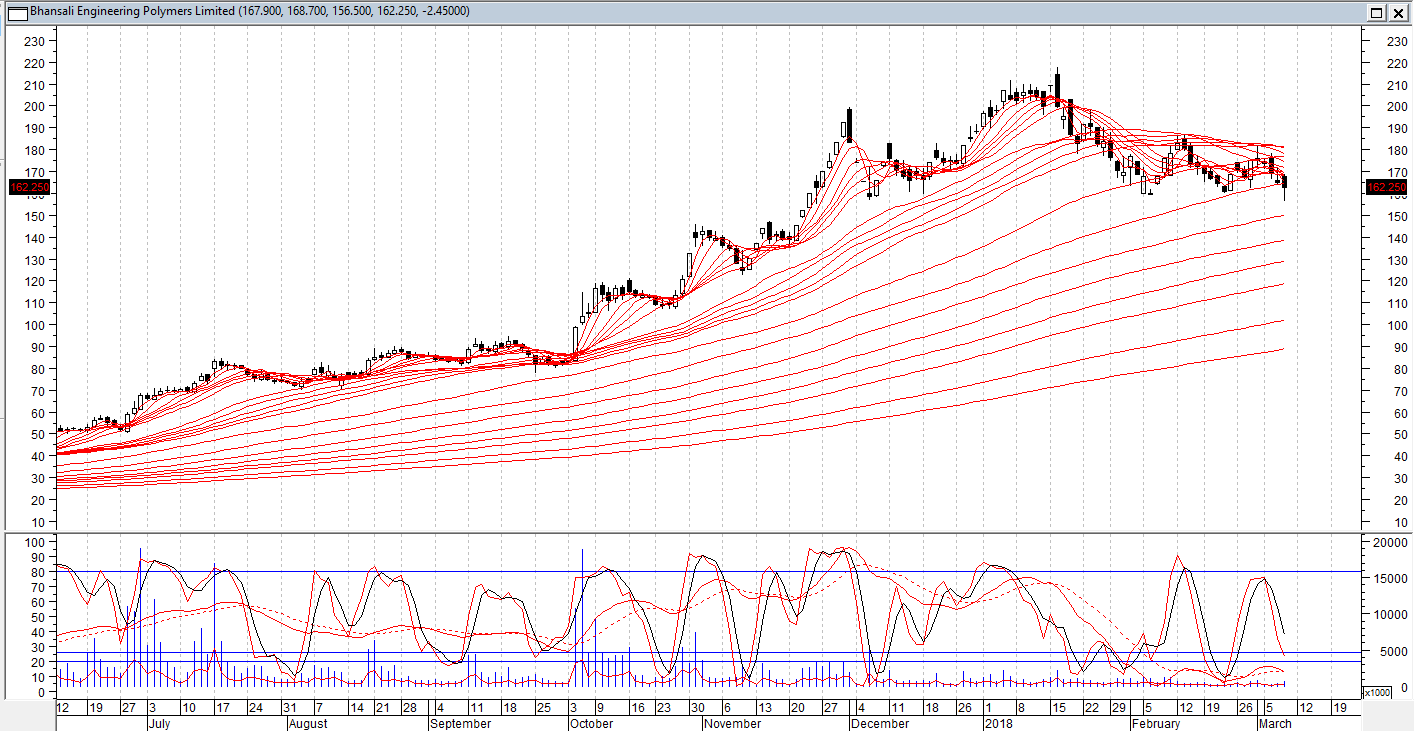
Another issue is that it has created a Head-N-Shoulder Pattern. Though, I’m bullish on long term, breaking on 160 levels with higher volume can cause this stock to see at least its 120’s
IMHO, it is incorrect to compare the performance on percentage basis of Topline growth Q-O-Q. May be you can compare Y-O-Y EBIDTA margin to confirm whether growth is maintained or is it decelarating. Pls see the following data.
Des D 17 D 16 Var% S 17 S 16 Var% J 17 J 16 Var% M 17 M 16 Var%
EBITDA 43.31 9.11 375.41% 37.81 15.50 143.94% 29.53 16.11 83.30% 21.92 11.56 89.62%
EBIDTM 16.79% 6.53% 12.91% 8.48% 11.76% 10.96% 10.12% 7.41%
D=Dec S=Sep J=June M=Mar
Sorry for poor formatting of data. This info is from Ratestar. It is seen that EBIDTA margin is improving Y-O-Y…
After remaining between 75 and 100 DMA for almost three weeks, the price has finally broken down the 100 DMA support in a strong market.
Disclosure: not invested. Waiting for prices to cool down.
Hi
I am new to the forum. Apologies if there is any error in my understanding/ out of context
Apart from sectors mentioned above, ABS has application in plastic trays/ other home items due to its high strength and low weight comparatively. I am also aware that there are some royalties/ patents involved for the production facilities. Funny thing is that (If my info is correct) there may be some production facilities producing bypassing above patent related issues and patent holders may not be able to track them. Is there a way to find out Actual Supply vs demand figures. Also, interested to find if there is something like off the patent scenario as in Pharma sector
Kind Regards
Jose
it has been raised by few people but I could not find anybody having any substantial answer to it, or maybe I missed out.
Could anybody please clarify that why promoters kept on purchasing shares from the open markets but didn’t reduce their pledge? Is it part of some strategy?