
its very ordinary. has the same useless data and events which supposedly moves the markets for a newbie. stock recommendations are also very safe in nature hence no real research required in names like mahindra and mahindra. this business will turn into prince not cause of the promoters or sudden excellent business plan. this is a cyclical business which gen is the last to move in any bull market cycle.
Dear @dj123, Many thanks for sharing your views. I second your view that they’re playing it safe in this research report. But, I appreciate the effort they’ve put in making their website and these reports appealing. Their website, in my opinion, is much better than many of its larger peers. It’s presence on social media is significant and their response to customer queries is prompt. It’s indeed a cyclical business but I believe that promoter quality does play a role in the company’s performance. In my interactions with Arihant customer executives, though few, I sensed a willingness to help. It’s a brutally competitive business but they’re doing the right things to make the most of this positive cycle.
Q2 2018 Results
Income growth: ~ 55 % YoY , 25 % QoQ
Bottom line:~ 65 % YoY, 8 % QoQ
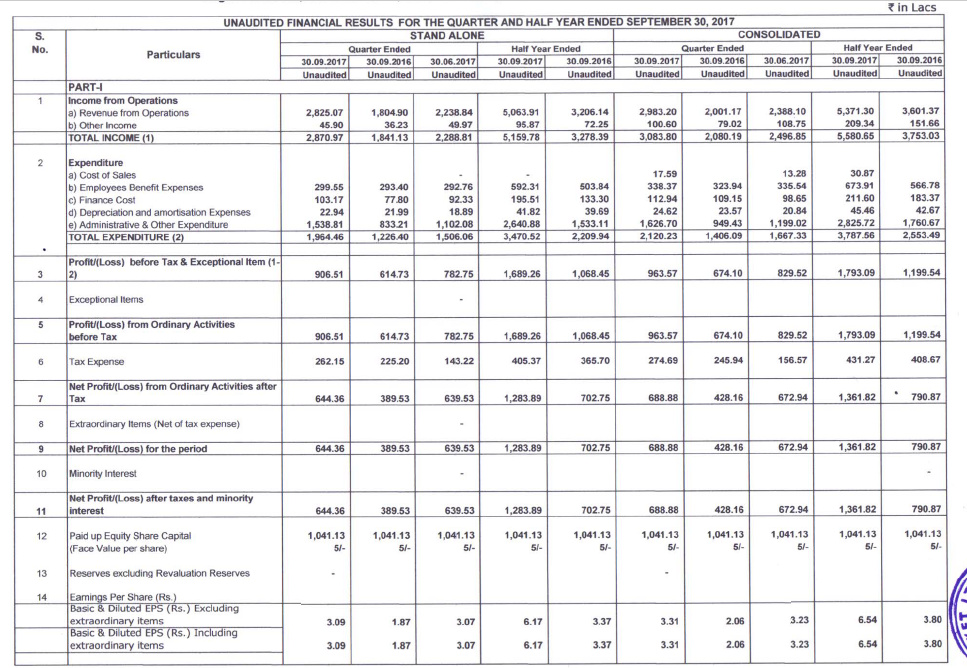
http://www.bseindia.com/xml-data/corpfiling/AttachLive/448d2ee3-b0ce-4e02-b842-4ca0e0f99351.pdf
1 Like
Arihant Capital seems to be a significant beneficiary of the long-term trend of Financialization of Savings currently underway. This, coupled with the annual increase in domestic savings due to growing economy, will result in significant increase in domestic flow into equity markets annually over the long term (though there might be a few down years along the way). Following are some of the statistics / research that support this view:
-
MF AuM as a % of GDP: USA: 90%; UK: 50%; China: 11%; India: 7%. Hence, even if India needs to catch up with countries like China, significant domestic money needs to flow to MFs (and hence equity markets).
-
Demat accounts have grown 4-fold during FY05-17 to 28 million (12% CAGR). Total household savings have grown as a CAGR of 12% over FY05-16 to USD 400 billion (about 20% of GDP). This trend is expected to accelerate going forward.
-
According to the Credit Suisse Wealth Report 2017, only about 15% of the wealth of an Indian Adult is in Financial Assets, compared with 45% for China and 70% for USA.
It seems the business of Arihant Capital currently depends more on domestic money flow to the markets and less on the FII money. Hence, even though there was no significant rise in the average FY17 vs FY16 market levels, the revenues and profits of Arihant grew significantly. The most likely reason was the significant rise in domestic fund flows to the equity markets during that period.
They also seem to moving up the value chain. For example, their Merchant Banking fees as a proportion of total revenue increased from 2% in FY16 to 14% in FY17.
To conclude, my strategy is to stay invested in Arihant Capital to benefit from the long term trend of Financialization of Domestic Savings. There is no point in moving in and out by trying to predict the minor downcycles within this this major uptrend. You may end up being out of the major trend by trying to pick such minor cyclical movements. Besides, the valuations (P/E of 16 and P/B of 3) are still fairly attractive and the Company is likely to benefit both form high profit growth as well as P/E re-rating over the next few years.
Disclosure: Invested for the last 2.5 years. No recent transactions.
4 Likes
Arihant Capital have released their Q3FY18 Results.
Although the consolidated revenue is flat YoY, the PAT has nearly doubled. The reason for nearly doubling of PAT despite flat revenue growth is a significant reduction in Other Expenses, by nearly Rs 7 cr (from 18 cr to 11 cr).
As no breakup is provided in the quarterly results, I went through the Other Expenses breakup in the FY17 AR. The following two major items are present in FY17:
- Sub-brokerage / Referral fees and Expenses: Rs 21.5 cr;
- Merchant Banking Expenses: Rs 8.9 cr.
Based on the above analysis, it seems the reason for flat revenue growth and doubling of PAT could be either of the following:
- They have changed their business model so as to significantly reduce the business received through low margin sub-brokerage channel, probably due to the sub-brokerage channel losing it’s relevance due to technological advancements whereby more and more clients prefer the direct online route.
OR
- Merchant Banking business being lumpy in nature, they did not get much Merchant Banking business for the quarter, resulting in both the corresponding revenue and expenses being absent.
This significant growth in EPS, combined with the recent price correction has resulted in P/E moderating to 12.2 and P/B to 2.7 that appear fairly attractive, keeping in view the significant increase in domestic money expected to flow to the equity markets over the next few years.
Disclosure: Invested for the past 2.5 years. No recent transactions.
2 Likes
Has anyone looked at the contingent liabilities (bank guarantees etc) of 200 crores in Arihant according to Screener? Is it driven by the nature of the business itself? Does every other company has same (v high) mcap to contingent liabilities ratio? On the FY17 balance sheet I could add up 100 crores of contingent liabilities in the Notes. Not sure how Screener is calculating 200+ crores.
Following is the breakup of Contingent Liabilities according to the FY17 AR (figures in Rs cr):
| Total Bank Guarantees for the Securities Business | 97 | ||||||||
|---|---|---|---|---|---|---|---|---|---|
| Bank Guarantees to BSE | 6 | ||||||||
| Bank Guarantees to National Securities Clearing Corp | 22 | ||||||||
| Bank Guarantees to Axis Bank towards margin for NSE F&O Clearing | 38 | ||||||||
| Bank Guarantees to National Commodities Clearing Corp | 20 | ||||||||
| Bank Guarantees to MCX | 11 |
Please note that the figure for MCX in the AR is Rs 110 cr. However, as this figure is abnormally large and as the corresponding figure for the previous year was only Rs 6 cr, it’s highly likely that an extra zero has been printed by mistake in the AR.
Now coming to the reasonableness of the above figure of Rs 97 cr, we need to find out the average weekly and daily securities turnover handled by them for FY17. As it is not mentioned in the AR, I arrived at the approximate figure using the following calculations:
Annual Brokerage for FY17: Rs 46 cr;
Assuming an average brokerage rate of 0.4%, the annual turnover comes to around Rs 11,000 cr, resulting in average approximate weekly turnover being Rs 200-240 cr, and daily turnover being Rs 40-50 cr. The bank guarantees of Rs 97 cr seem quite reasonable keeping in view these turnover figures. Besides, a component of these guarantees is fixed, irrespective of turnover.
Apart from the bank guarantees for the securities business, there is also a corporate guarantee of Rs 40 cr on behalf of their real estate (wholly owned) subsidiary that again seems reasonable.
Looks like this liability is 29 crores.
Is there a way to confirm this? AR is usually meticulously vetted for typos. Specially when the amounts involved are so material!
I was looking at Emkay Global’s AR and couldn’t find any contingent liability/bank guarantee there. Which makes me wonder why Arihant is required to give such extensive guarantees to remain in business while its closest competitor doesn’t?
Now I am not an expert on brokerage business…just playing devil’s advocate here.
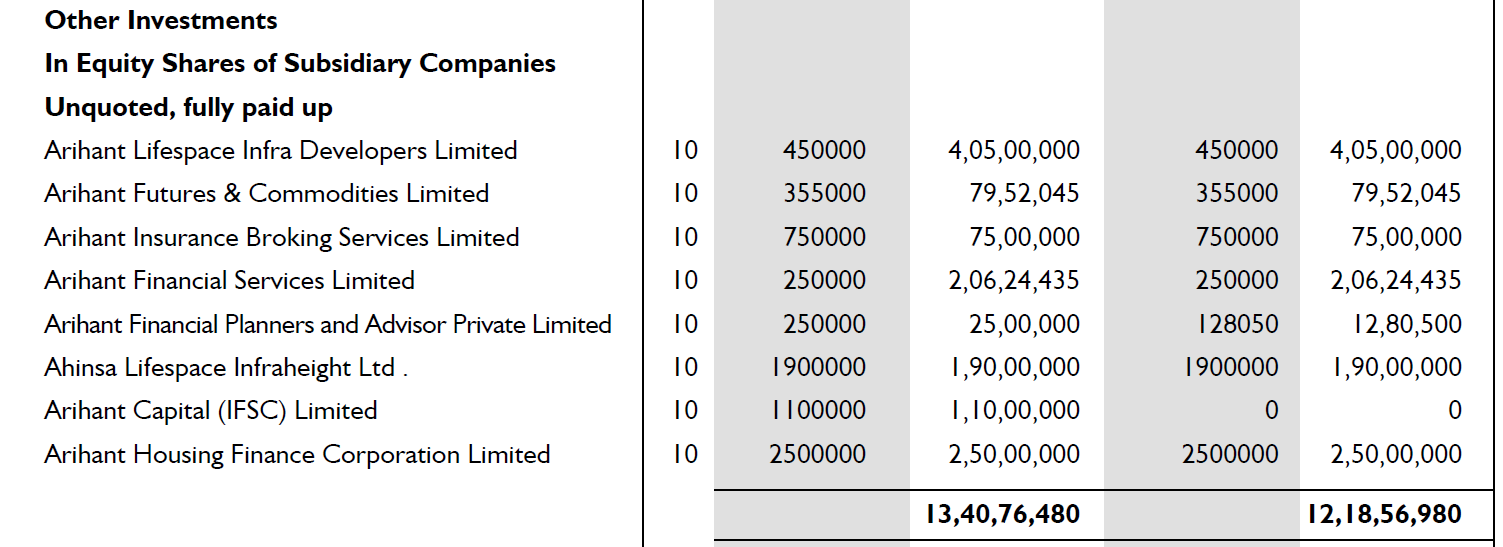
Also, the corporate structure of this company is very confusing. Too many subsidiaries and too much give and take amongst them. One thing I noticed : why is stake in some subsidiaries recorded in NCI in BS at face value (eg. Arihant HFC) and others at above face value (eg. Arihant Financial Services) ?
Will be posting more question if I take a detailed look.
Disc: No long or short position
1 Like
Yes - You can write to their Company Secretary for clarification.
All exchanges require bank guarantees from their participants, though I have noticed that a few brokers do not disclose these figures under Contingent Liabilities in their AR.
Most Companies in the Financial / Capital Market / Real Estate businesses have a large number of subsidiaries (IIFL has 30+ subsidiaries, Edelweiss has about 70 subsidiaries / JV). It seems the reason is that having a subsidiary structure helps in certain regulatory aspects and fixing of internal responsibilities. In any case, the Standalone PBT of Arihant Capital comprises about 90% of the Consolidated PBT for FY17.
Based on the chart above, the “give and take” between most subsidiaries varies from Rs 25 lakh to 2 cr. The total figure is about 13 cr that is not “too much” according to me.
I’d like to begin by tendering an apology for asking questions pertaining to the price of a stock. But, I feel that I must share my concerns here. Despite decent results, Arihant Capital has been in a constant downward spiral. It has shaved off close to 40 percent of the gains from its peak.
Could someone possibly enlighten me if the prospects continue to be bright?
I ask this since the market sentiment seems unrewarding for broking companies right now.
Should we anticipate more fall?
I entered into stock at around 160 back in November’17. Stock price moved a bit, went to 200 prior to Q-2 results and then tracked back to 160-170 again. In a way, stock completely missed small cap rally of last 4-5 months of 2017. I exited around Jan at no profit-no loss, with a sort of sudden realization. Now, I am not saying that stock will never go up or will always be available at low multiples. But somehow, it occurred to me that in the age of discount brokers like zerodha, there is very little to differentiate among brokerage firms. Bigger ones have reached a critical mass and will retain their market position, but life is going to be uncertain for smaller firms. In the age of internet and mobile apps, this business will fast become a commodity business with no. of users dictating terms.
In reality, things may turn out to be very different and I may be wrong about the prospects of industry and the company. Even in past also, this stock had this tendency of making sudden big movements. Let’s see.
But I thought that it may be useful to put across my thought process.
Status: no current holding
1 Like
Arihant has shown considerable rise in both the Price and EPS over the past 4 years. Even after the current fall of about 40% from it’s peak, it’s price still up a staggering 8-fold over the past 4 years. Even the EPS has grown about 4-fold during this period, resulting in very reasonable valuations even after such a rise.
Now as to the question of what to expect going forward - that depends on your opinion on the state of capital markets over the next few years and the flow of domestic money into the capital markets.
Personally speaking, I am fairly positive on the capital markets over the next few years and hence am holding on to Arihant Capital (it’s a kind of high beta play on the capital markets), though after a stock becomes 7 or 8 bagger for you, it’s relative share rises in your portfolio and you might have to do some rebalancing.
1 Like
Zerodha has been around for quite some time (since 2010). Even though it has been growing quite a lot in terms of subscribers, that has not been at the expense of other brokers such as Arihant who have also been growing at a tremendous pace. There seems to be enough business to accommodate 25-30 players at the national level (a blend of discount, full service, and those in between).
1 Like
Fair enough. Stocks do take their own time for price discovery, which can be hugely frustrating and rewarding at the same time.
The key to valuation is in discovering the revenue split from its various segments. That’s where the surprise is in store. This is very much a cyclical business.
CMP 108.15
52Wk H/L 204.50 / 50.00
Close to 50% retracement. Broken key support at around 130 levels; Next support around 100 levels?
When would be a good time to add to positions?
The latest results of Arihant and other Companies in the Capital Markets Sector clearly show at least an intermediate cyclical downturn for this sector.
Apart from the sector-wide downturn, there are certain Company specific factors that have significantly reduced the attractiveness of Arihant compared to 3 years back when this thread was started.
The valuations (P/B, D/Y, etc) are now more than 3 times the valuations back then.
The Company has diversified into Residential Real Estate and financed the same by debt. Hence, it’s D/E has now touched almost 1, from being a zero debt Company 3 years back. Any further cyclical deterioration in profits will have a multiplier effect due to fixed interest payment obligations. This has also resulted in it increasingly becoming a play on Capital Markets + Real Estate from being a pure Capital Markets play 3 years back.
As mentioned in an earlier post, I had sold a portion of my holdings a few months back, primarily to rebalance my portfolio. The remaining holdings have been sold recently after the Q4 results.
Overall, this investment has provided me about 430% return in less than 3 years when the overall market has given barely 50% return.
I will continue to track this Company and this Sector for any future investment opportunities and might invest again in future if the risk-return tradeoff improves significantly.
5 Likes