Q3 fy16 - flattish results. No surprises
Sales: 122cr
Ebitda: 23cr
Pat: 11cr
Q3 fy16 - flattish results. No surprises
Sales: 122cr
Ebitda: 23cr
Pat: 11cr
Guys, think twice before posting. If it does not add any value, please avoid it.
Ambika Cotton Mills Ltd has informed BSE that the Board of Directors of the Company at its meeting held on March 12, 2016, has recommended for payment of Interim Dividend at 150% (Rs.15/- per share) for the Financial Year 2015-16.
Disc: Invested
Amid declining cotton prices since 2011, Ambika was able to hold onto it’s OPM around 20%. It was also able to increase it’s 5 years sales at 18% approx. But the continuous drop in cotton prices which is at 57 cents/lb currently compared to 210 cents/lb in 2011, as per data (Trade Economics) worries me a lot.
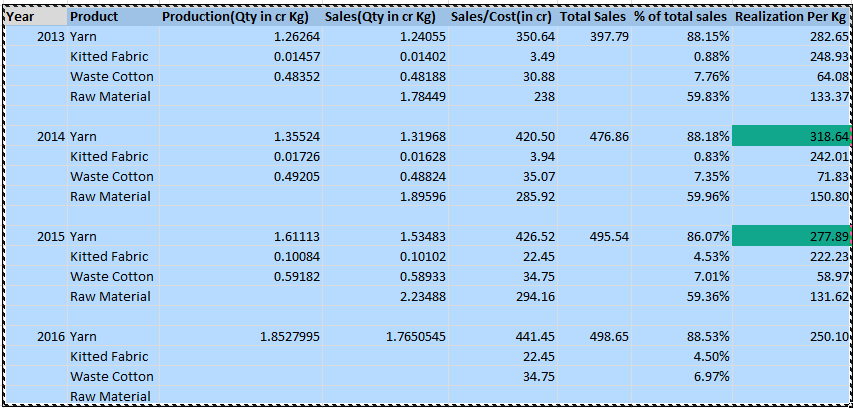
As per Quantitative info on Ambika Site (Quantitative Info) I created a table which shows that they are able to increase their sales(Yarn Qty in Kg) continuously from 2013 to 2015. But due to decrease in cotton prices they have also passed in price benefits to their customers.
As per my analysis, realization per kg of yarn is Rs 282 in 2013, Rs 318 in 2014 and Rs 277 in 2015. If cotton continues to fall and even if Ambika increases it’s sales(Qty) by 15% a year, it will not be able to have a substantial increase in revenues(Rs).
For example, in FY 2015 the cotton prices fell from 90 cents to 60 cents. which is 33% decline. Yet drop in realization of ambika yarn prices were 13%. Some price was passed on to customers yet OPM were intact (good to see) but revenue was flat. For FY16 cotton price are range bound around 60 cents (+6% to -6%) and Ambika is showing a flat revenue (considering a 15% increase in sales qty and 10% decrease in price realization).
Does that mean it is using the full capacity now and it needs increase in capacity to increase revenue from here on ? Announcement of Capex plan hint in that direction.
One striking thing I noticed is that there is a 5 times jump in knitted fabric sales in FY15. Which also hints that Ambika is moving towards forward integration. Will be interesting to see fabric percentage in FY16 revenue.
The past record is amazing. Short term looks flat. The down cycle of cotton is going to hurt even if ambika increases sales. We need to monitor how does Ambika go on from here. Specially, how does the capex converts in increase in revenue and profits ? Request seniors to comment. @Donald, @ayushmit , @hitesh2710
Hi @ffaizan,
Can you please share the source for the quantitative data (sales volumes)? I think they were giving the same only till 2011, till reporting of quantitative details was mandatory. If we have this data, it will be useful.
Being a B2B business, its obvious that the realizations will fall inline with the fall in cotton prices. Its good that the company has been able to hold on to good margins despite the fall in cotton prices…others get hit by inventory losses. Regarding growth - the company had announced expansion of capacity, the growth should come when that gets operational.
Regards.
Ayush
Hi Ayush,
The link was on their website. Also in my post as Quantitative Info hyperlink. I am reposting again for your reference. This has data from 2013 to 2015
Hi @ffaizan,
Sorry, i missed noticing the link earlier. This data helps. Can we try plotting the realizations of the company vs the price of cotton? (more specifically supima cotton)
Regards,
Ayush
Thanks Ayush for your reply. Though I was not able to find out supima cotton price movements and how it exactly contributes in the total cotton used by Ambika.
One thing is clear that they are able to keep raw material cost to 60% of sales and OPM to 18-20% even when cotton declined so sharply in last few years.
Hi, I am new to this forum, but I have been following the Ambika discussion for quite some time. All the people here have done an amazing job in researching the company.
I have been working on the company for quite some time and one of the many interesting aspects which I noticed was the sharp decline in operating margins in 2012 which then stayed at those levels. I have attached a small piece from my note on Ambika of what I believe could be the reason below
I believe the decline in margins could be on account of any of the factors below:
• Compact spinning becomes ubiquitous: Ambika was one of the earliest adopters of compact spinning in the country and as the technology became ubiquitous, the premium it could charge for superior technology has come down
• Declining bargaining power: Ambika’s clients are able to negotiate better terms given their considerable size, and coupled with compact spinning becoming common they might be getting acceptable yarn from competitors.
• Evolution from operating margin focus to focus on EBITDA per spindle: In the previous decade, the Company in multiple annual reports has clearly indicated its focus on maintaining margins without orienting itself to any particular markets. However, recently, the Company has turned its focus to EBITDA per spindle and it has among the best EBITDA per spindle ratios in the industry. In my opinion this strategy makes sense, as higher EBITDA per spindles imply higher profits and cash flow generation per spindle. Despite lower margins over the last four years, the EBIDTA per spindle has increased noticeably. EBITDA per spindle ratios for 2008 and 2009 are affected by the capacity addition.
• Deliberate strategy to become the low cost producer: I suspect this reduction of margins could be a deliberate ploy to develop a low cost advantage which would increase the switching cost of the customer. When you think about it, if Ambika is giving its customers a superior product which is an important raw material for the customer at a lower cost, why would the customer leave Ambika?
As Bakshi sir mentioned in his interview with Shane Parrish: “If you have a business where you have a low cost advantage, or you’re selling something that is really good, and cheap, and it has a brand, and creates brand loyalty, and you’re selling it at a low price and in the process you can still get a high return on capital, I think of that as far more admirable as a business model, than when you are selling at higher prices”.
Now an important point to confirm is if the profit decline came at the cost of returns of capital.
The returns on capital have in fact increased over the past four years since the margins have come down from ~15% to ~20%. The Company seems to have in fact increased the customer captivity while improving the returns on capital.
These higher returns were achieved through higher turnover of inventory, which has increased by more than three times from 0.7x in 2006 to 2.4x in 2015.
What this means is that whatever quantity Ambika has produced it has been able to sell to its customers (total quantity of yarn sold has increased by 40% since 2010 without any increase in spindle capacity). This implies the customers are enjoying strong demand for their products (and hence their requirements are increasing) or that the company is eating into the share of its competitors who provide yarn to the same customers.
Now, the margin decline could be on account of the all the above reasons. But the operating margin decline accompanied by increased production and an increase in return on capital leads me to believe it could be a more conscious strategic decision taken.
Rohit,
The note is truely indepth and insightful. Many thanks for uploading this. Keep up the good work.
@rohithpotti
Thanks for the insightful write up.
Would you like to mention the entry barriers? Sorry If I have missed that part while going through you document.
At least the “switching cost” thing doesn’t appear to be very convincing in this case(I may be wrong). The details and specifics of the key risk(s) of switching is welcomed.
Quote from your document :
“This low cost of an essential raw material implies that the perceived benefit for an end customer to switch from Ambika’s products is low, which creates high switching cost for the customer.”
It would have sounded more confident if it was zero or negative. There are many companies that may be happy even with lower benefits from switching raw material suppliers.
When we were in school, we travelled 10 mins to get to a distant shop that sold egg rolls 3Rs. cheaper than the nearest stall. I guess I don’t have to feel ashamed as kids still do that.That is how kids survive.
@ricky_
Thank you for your comments.
You bring up a very pertinent point with an interesting example.
I will try to explain why I think the switching cost is high with an example:
Consider the clothes that you can buy on the link road, crawford market or any other road side place for that matter. The garment manufacturer there would as you said, happy with lower benefits from switching raw material suppliers.
Now consider the premium shirt manufacturers - Raymond (Ambika’s customers I suspect sell shirts which are at a higher premium to Raymond also). Premium shirt manufacturers are very very finicky about the raw material that is supplied to them. They will not buy it just from anybody. And given Ambika’s products form only <3% of their customer’s total cost, why would they switch?
The above is confirmed by the quantity of yarn sold by Ambika. If you see my note you would notice that the quantity of yarn sold by Ambika has increased almost every year for the last ten years. This indicates customers are buying more and more from Ambika.
And they have done this while reducing their price, which would again increase the switching cost.
An analogy could be Apple phone vs a Lava phone. Do you think Apple will shift its raw material supplier purely based on cost benefits? I think not.
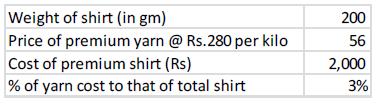
Hi Rohit- Thanks for your detailed and insightful note. IMHO this assumption that yarn forms only 3% of the total cost may be revisited. Assuming premium shirt retails at Rs 2000 and the cost of shirt production is not more than 60% of the retail price which would mean that yarn would actual be closer 5-6% of the cost of the shirt sold (assuming negligible wastage). We would also have to take into account the final profit that a premium shirt-maker makes. Assuming net margin is 10% of the sales- then lowering his yarn cost from 6% of sales to 5%- the overall profitability would increase by 10%. I think we can try to validate this by looking at financials of any listed premium shirtmaker.
Will I be correct if I say that Ambika’s customers are so satisfied that they will not even care to check out what Ambika’s peers are selling,even if their products are superior than that of Ambika’s?
@sagarwal04
You bring up a very interesting point. Here is how I thought about it.
I think Arrow, Blackberry and such companies’ sell shirts at 2000. I do not think Ambika sells to them. Ambika imports Supima ELS cotton and sells to Supima shirt manufacturers and retailers. Now if you see the brands that sell shirts made of Supima cotton (you can easily find them from their website), they include brands like Brook Brothers, Dillards, etc. These brands sell shirts starting from around 4,000 and it goes much above that price. So, if you see, my assumed cost of 2000 is 50% of the lower end of the retail price. I am being approximately right here, majority of the shirts are at 4000 or above.
Also, I have taken the weight of the shirt as 200gm. Now I have not weighed shirts myself, but I am reasonably sure the average weight of men’s and women’s shirt is less 200gm.
They also provide yarn for hosiery. Base on back of the envelope calculations, I believe the cost of yarn to final product there could be even lower.
Overall, I believe the calculation in the note is conservative.
Do let me know if that makes sense.
@ricky_
I do not know if they check the competitor’s products. All I am reasonably sure of is that is if Ambika continues to do what it is doing right now, the probability that an existing customer will shift is very very low.
As a matter of fact, the company is expanding its capacity and the entire capacity will be used to serve existing customers. No new customer is being added. That does tell you something about the demand for Chandran sir’s yarn.
Seeing the discussion in last few days I am thinking does Ambika have any negative points also ??
If there is no risks and negatives is it quoting at cheap valuations only due to inefficient pricing or past volatility ??
I think we need to dig further and re check once again …The risks mentioned in the pdf also doesn’t seem convincing .
What I feel is that there is too much chance that the peers will produce the same quality(if not better) products as produced by Ambika till now. The problem will get further worsened if they offer their products cheaper than Ambika.
But the moat (or whatever you call that) is still intact and may not have started eroding.
My Understanding of this is that since there are so many players in this space, and most of them are looking to innovate to gain better market share, market is waiting to see if this “moat” actually lasts.
And if in the next couple of years they still hold that edge over competitors, there could be a rerating of the stock.
Hi Rohit,
I loved reading your note on Ambika. I think you have done a fantastic job of covering all the important points relevant to understanding Ambika cotton and making it easy  Thanks for sharing.
Regards,
Ayush
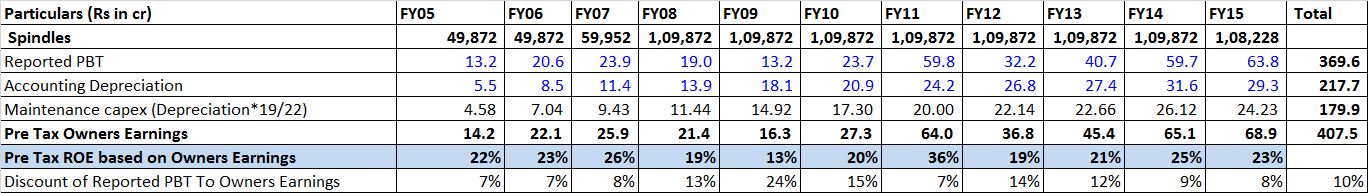
Hi guys, I was thinking about Ambika Cotton mills from the Owners Earnings perspective and this is my conclusion - Under two different scenarios, the Pre-tax owners earnings are understated by atleast 8-10% in the conservative scenario and by 29% in the aggressive scenario.
I am hereby attaching an extract of my calculation for owners earnings of Ambika.
Conservative Scenario -
Just a few pointers on my calculations -
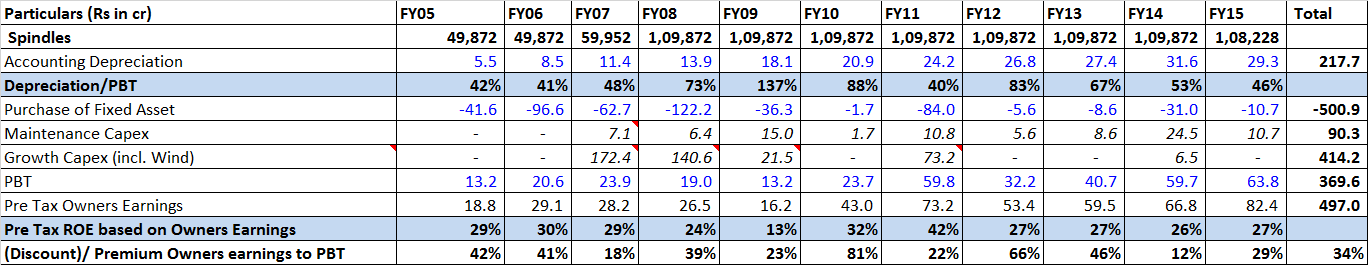
Aggressive scenario -
Capex information has been given in all annual reports in the directors report section. I have tried to cull that information out and i have prepared an alternative scenario for calculating the maintenance capex. We know that reducing the figure of growth capex from total purchase of fixed assets, the balance should be maintenance capex. After doing this calculation, i found out that pre-tax owners earnings exceed reported PBT by ~128cr in total for FY05-FY15. Also since in textile companies capex happens in spurts, it is safe to assume that once the capex cycle is over, additional capex in the Cash flow statement shall be maintenance capex.
It will be better to look at the FY05-FY09 figures cumulatively since break-up of growth capex and maintenance capex is difficult due to absence of information in the Annual Report of 2005 and 2006.
In any case, the cumulative growth capex comes to around 414cr, maintenance capex is ~90cr while the total depreciation comes to ~275cr. Thus, we see that the Owners earnings will be higher than reported PBT for FY05-FY15 by (275-90) 185cr.
Now if we see just for FY15, the reported PBT is 64cr and the owners earnings are 82.4cr. Pre-tax owners earnings to Market cap (yield) comes to around 16% (82.4/510) which offers sufficient margin of safety in my opinion. Also, Post tax owners earnings is 82.4*(1-tax rate) = ~58cr. Hence, P/E ratio comes to 8.5x, whereas the current multiple based on reported Net income as on FY2015 is ~10.7x. In short, owners earnings are at a discount of 25% to the current multiple.
I may be incorrect in my calculations and thus am posting in this forum hoping the moderator(s)/senior investors would guide me to a better understanding of concept.
Thank you for your time.
Disclosure: I am invested.