@namans@karanmaroo
Brilliant value-additive work!
Thank you for doing the compilation work and sharing for the benefit of all
Re: Nitin Spinner performance
Per/Spindle Topline and growth for a lower count player is always higher (GPSS @200+ at 30s vs @50+ at 80s). So this was on expected lines
Per/Spindle EBITDA comparison comes off better for Nitin - those who have studied Nitin well ( @Aveek )can comment on the sources of higher profitability
Bad years shouldn’t be neglected - Textiles is quite cyclical - that should get factored in
There are some like Ambika who have not added a single spindle for years (Not that is a good thing) but continued to generate higher Topline & Ebitda growth every year - showcases the ability to move up the value chain. You can play this game only for so long even for a very capable player like Ambika. At some point you have to expand spindle capacity
Yes, North based mills have a big incentive to set up additional capacities, but the absence of those incentives are not the reason for South Mills ( mostly in TN) refraining from putting up capacities, as per my enquiries.
It was the total uncertainty in power availability in TN, much higher per unit charges beyond thresholds in peak hours, with power deficits not showing signs of abating.
2015 is the first year, everybody is saying the power deficit is almost closed, and thus we have most of the TN Mills now planning for expansion including Ambika
Good time now for me to look up my Notes and share the South vs North Mills saga as heard from a veteran of the Industry!
Guys, you may like to share your respective Excels? so other enthusiasts can also take your work forward - without re-inventing the wheel
So we get Highest EBIDTA per Spindle at Rs 8246 in FY11 for Ambika in the sample and average of Rs 7,300 per spindle. Let us assume additional capex of Rs 45,000 per spindle and 7.5% Depreciation. We shall get Annual depreciation of Rs 3375 per spindle, EBIT of ~ Rs 4,000 per spindle. Now on Capital cost of Rs 45,000 per spindle, the incremental ROCE would be around 8-9%. Let us add 2% for TUF subsidy. So while my original calculation was giving number of around 14-15%, on these calculation, the number is around 11-12%, over a cycle. That is a problem in my understanding. While no concern on the management quality, industry financial itself is a challenge.
I further see headwind in form of increase in Cotton price in India due to diversion of land by farmers to other crop. The revival in .last 5 years profitability I see as one off. The BT cotton improved yield from 250 kgs/ hectare to 500 kgs/hectare. So with double yield, farmer increased area under cutlivation/maintain under area cultivation. Even at 25% long term average price, it was remunerative for farmer to cutilivate the cotton. So the productivity gain in farm has assisted spinning sector most. Now with around 75-80% land under BT cotton, the future productivity gain would be limited and hence we shall see cost push. Till 1990s, India was among Top 5 importer of cotton, which shifted to became exporter from early 2000. That dynamic also impacted global cotton crop price softer.
I see the structural change in Indian cotton sector as more a driver of profitability, supported with TUF loan and not least efficient management (in cases like Amibka). But pure good management, would ensure that business does not run into loss in bad time, but would not be able to create value for shareholder. For the other family run companies, there is huge mark up in sourcing cotton which increase in procurement cost. That element is definitely missing in Ambika and other good management.
Having said that, coming back to main question, whether without expansion can Ambika deliver further gain from price increase? Secondly, with expansion, how does it generate superior ROCE?
Please read" Even at 25% long term average price"as “Even at 75% of long term average price (25% discount, with 100% production gain being pass to the spinner by farmers”. There is cost increase also due to BT Seed, but that partially offest by lower pesticide usage. In 1990s, pesticide account 70% of consumption, and cotton accounted for 70% of pesticide in the country.
Karan - Why is there a difference between the EBIDTA/spindle figure of yours and Naman’s? Figure at my end are similar to the one posted by Naman.
Yes, Northern States have given lots of incentives and the power situation has been much much better. The textile companies in South were crippled due to power issues. Though power situation is finally getting better now.
Dhiraj - Nice to see your quick calculation. Yes, if the EBIDTA per spindle are to revert back to 7000-7500 levels then the ROCE won’t be very attractive. Regarding your view on headwind due to increase in cotton prices - I don’t think it will matter. Rather, rising cotton prices are usually positive for good players like Ambika. Companies suffer inventory losses when there is sudden fall in cotton prices and that can’t be managed easily.
Ayush - I think there is a difference between the approach Naman & you would have used for calculating EBITDA and what I have used.
I have removed other operating income (profit on sale of machinery, duty draw back, wind energy) from EBITDA and taken it below that line item (Other income) in order to calculate the core operating income per spindle. I have done that for all names.
You are right - there is a substantial difference due to this.
Dhiraj, I think you mentioned this before as well and I agree with your calcuation. I did the numbers for Nitin, they point to a similar figure, even though they are at lower end of count etc
The moot point for me is- what is the merit in looking at businesses which are incrementally earning ROCE much below your cost of capital. When you have better businesses which are earning higher ROCE, do you really want to look at such businesses.
Also, is there any benefit for Ambika or any other player being in higher count if they can’t earn higher ROC
Also, another point from all this is that these businesses will be highly capital intensive and any growth higher than the return on capital will start to deteriorate the capital structure of the company either by way of debt or by equity which will lead to dilution. The implication being the returns of shareholders won’t be great.
Sure, these back of the envelope and over the life of an asset you will perhaps higher ROCE given the depreciation and the fact that the real life of an asset would be more. But just thinking about the business from an incremental capital point of view, which is a pretty important number,
But is it worth being an investor in such businesses at all?
During a normalized year, Ambika might earn ROICs which are comparable to that of the best players in the lower count yarn industry as well. However, it is during the trough of a cycle that Ambika seems resilient (we need to investigate why - possibly, premium shirts are not as affected by cycles plus Ambika’s high margins allow it to absorb cotton fluctuations better plus Ambika’s quality??). This, to my mind, is why an investor might look at Ambika. An attractive company (?) in a not-so attractive industry
But, does it meet your absolute benchmark? I mean if Ambika is able to earn 13-14% when others are earning say 10-11% then that’s great for Ambika. But would you want to look at Ambika on an standalone basis?
The issue with this analysis is that we are only looking at based on current figures maybe things for Ambika are changing (will change) which will enable them to earn higher returns on capital on an absolute level and thus also on a relative level on a sustained basis.
Are there any levers here- 1) margin increase? 2) Productivity & Efficiency increase (Gross Block Turnover ratio improvement and Working capital getting efficient.
That would be an even more interesting discussion.
Rohit - Cannot answer that without studying the Returns numbers in detail, we certainly have to look at it
On power again - anyone has an idea of how it works in textile companies?
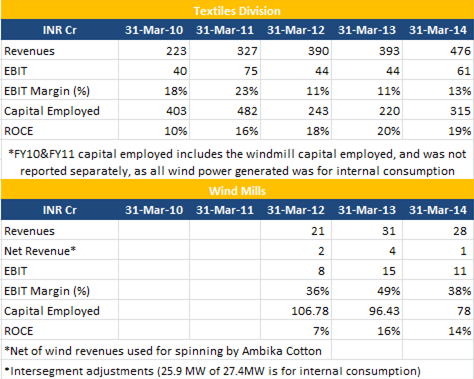
For example, Ambika has in-house wind energy generating capacity of 27.4 MW which meets all its power needs.
So does this mean that power generated out of this wind energy is supplied to the grid, the grid in-turn supplies electricity out of the general pool to Ambika and the value of power generated is finally set-off in the bill? Or does it mean that Ambika is able to use the power directly (This should ideally not be practical as windmills are generally located in empty areas far away from factories or human habitation)
Have also reviewed the EBIT margins earned by Ambika for both the textile and wind division. It has made 13% EBIT margins in FY14 with a ROCE of 20%+, which is the year when Ambika seems to have turbo charged its focus on high end yarn (even in prior years it made 11%+)…So on a 45,000 revenue, it can earn 5,000 - 6,000 EBIT (net of depreciation) (11%-13% EBIT), which on a capex of 40,000 - 45,000 per spindle is 11% - 15% ROCE, and with TUFS it will be higher. Let me know if my thinking is right.
What we really need to establish is why can Ambika going forward earn a higher ROCE/ margin - is it linked to lower capex, better productivity, better realizations?
One point that I did not understand from the segment breakup is why is EBIT for wind division more than its revenue? How is EBIT determined segmentwise?
@karanmaroo - I think the power generated out of wind energy is supplied to the grid, as the Annual Report says that “Intersegment Revenue is the value of power adjusted by State Government Corporation (TANGEDCO) in electricity bills of spinning segment”…though anyone who is aware please confirm.
Also, we should include duty drawback and export incentives as part of income for these companies, because this is recurring income which increases with the scale of the business…The government would not take these away as these export sectors like apparel, weaving, spinning etc are highly employment generating, and most companies in this sector would not survive without these incentives.
@rohitbalakrish_ I think due to so much of data and discussions we are loosing the key points. Ambika does stand out when we compare to so many players and the business seems to have undergone some good positive changes over last 2-3 years which is very much evident in the improved ROCE nos also. The ROCE for last two years is 20%+ and for this year also it should be much higher. So we are trying to establish the reasons behind the same and then see if the company can repeat the same for next 3-5 years.
Is the co a much better player now having undergone the test of times?
Yes, I agree with Naman. We should take other operating income as part of the normal income.
@Naman - regarding the table that you have computed on the wind mill segment, I don’t think its correct. The wind power is for captive consumption and the model would be that the wind mill supplies to the Grid and the co gets a credit for the same in its power bill. Hence if you take the FY14 nos - the gross revenue from wind mill was 27.62 Cr and 26.81 of it was set off as inter-segment revenue. Probably, the EBIT which you have taken indicates the profit from wind mill after deducting depreciation - it has high margin as the cost of running wind mill is almost nothing.
Yes, I agree. In fact the real fun is to find companies which can make those high RoCE before they actually make it, because then you make outsized returns- business profile improving and thus a kicker both in terms of earnings as well as market valuations.
Having said that, specific to the yarn companies such as Ambika & Nitin- do you find any error in the way I was thinking i.e. Incremental return on the capital and thus looking at their attractiveness as a shareholder?
Also on Ambika specifically, maybe because they haven’t done capex in the last 3-4 years, the assets could be on a fully depreciated basis that could be a reason for higher ROCE?
Thanks @ayushmit for providing an understanding of the wind mill working and reason for high EBIT…
The wind calculations are from the segmental results in the Annual Report…FY14 AR (http://www.bseindia.com/bseplus/AnnualReport/531978/5319780314.pdf) page 44 provides the details…It shows that depreciation is high @12 crore, and as you suggested given the operating cost for windmill is almost nothing, it results in high EBIT…
In between I also got this thought that as they haven’t expanded for last 5 years - is that the reason for improved ratios and ROCE. But probably thats not the reason because if you look at the Net block for last 5 years it has remained sort of constant (They kept doing small capex in this period):
Also, I did a back of envelope cash flow based analysis of a scenario if Ambika goes for one shot capacity expansion by another 100,000 spindle with an assumption that from day one EBITDA / Spindle would be at current level of Rs. 9400/- (possibly an unlikely scenario in first year though) … The purpose is to see
how feasible it is to do capacity creation in one go or to go in phases…
How does it look like if we just think it as another new company just mimicking Ambika with all its “expertise” and “efficiency” (imagine an exact clone of Ambika) ---- Will we be excited with the resultant cash flow accruing to owners’ for first 7 years from this new investment?
Let’s assume it would add some forward integration too to avail 5% interest subsidy benefit instead of 2% applicable for only spinning expansion (refer TUF scheme) …
The Free Incremental Cash Flow in Owners’ Hand in year 1 and 2 as per my calculation is Rs. 12.47 Cr. and 15.64 Cr respectively.
ROCE is going to go down… So, I tried to find out Incremental FCF case for new expansion…
The excel is crude 5 mins job … But can be fine tuned by anyone interested … Tweak any assumption I have taken in interest rate / tax rate etc…
Please comment and improve upon the New Expansion Project plan of Ambika… Let’s think we have cloned everything from Ambika and starting a project with 100% loan fund and we are the owners’
Objective of the analysis is to see how the New Investment case would excite a new investor? Will he be excited / lukewarm / negative?? And why??
Was going through the thread again: have a couple of queries from posters
@Donald - You’ve mentioned pre-booking for 4-6 months; is this for the finer counts industry in general, or Ambika specifically? (I presume the source of this data is scuttlebutt) @Vivek_6954 - New machines for 2017 for Ambika - Is the source of this data scuttlebutt? Any information on how many machines / location for expansion etc?