
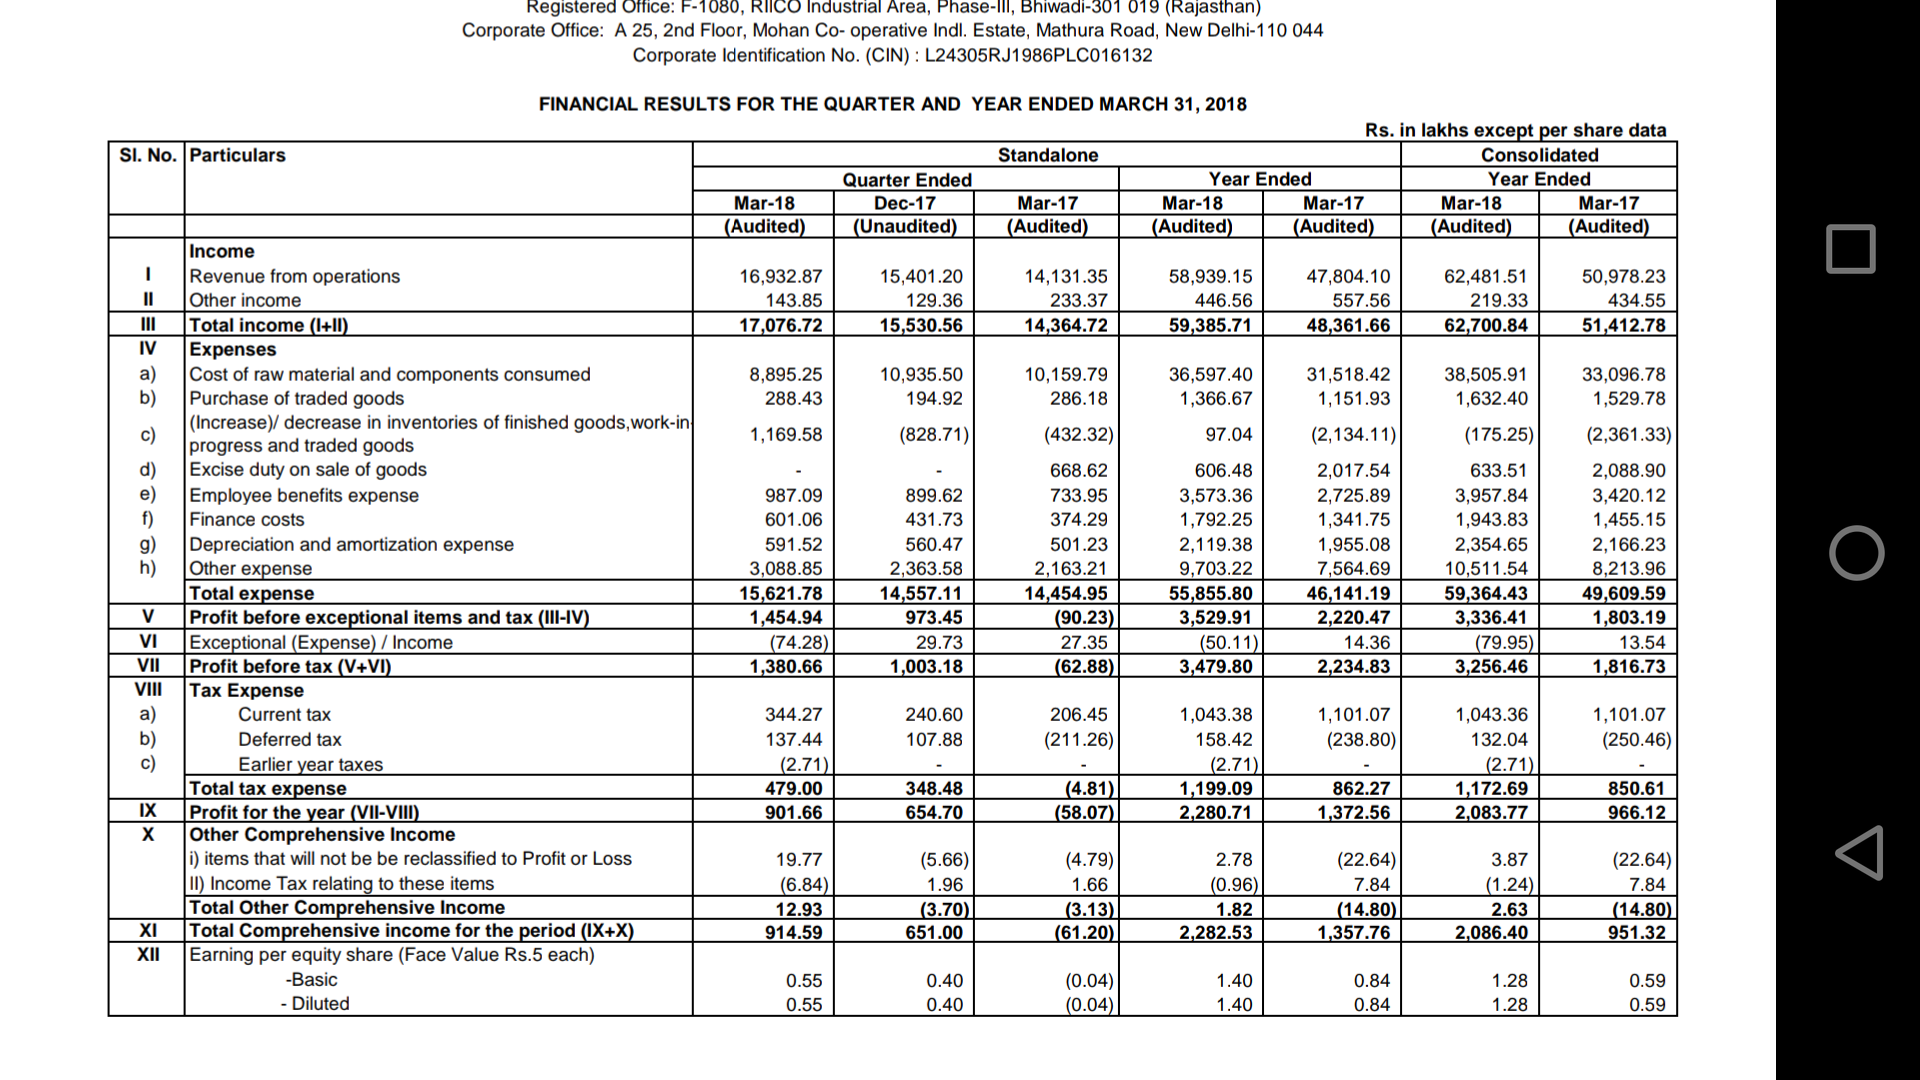
Good result posted…Though revenue is little less than expected
Excellent results posted by Aksh Optifibre. I like how Aksh is becoming consistent in the last few quarters. The capacity expansion is helping better the numbers quarter after quarter.
QoQ comparison:
Revenue up by 9.95%
PAT up by 37.7%
EBITDA margin improved - From 12.95% (Q3) to 15.2% (Q4)
Segment-wise
a. Manufacturing
Revenue up by 4.7%
EBIT margin improved - From 10.8% (Q3) to 12.3%(Q4)
b. Trading
Revenue down by 13%, but profit up.
EPIT margin improved - From 19.1% (Q3) to 33.1% (Q4)
c. Services
Revenue up by a massive 186.8%
But it’s still loss making. A very good point to note here is that the amount of loss remains the same despite the huge increase in revenue. This indicates this segement is getting better.
EPS for this quarter is 0.55rs. But there was an exceptional expense of 74 lakhs. Usually in the past quarters, there would be exceptional income of around 27 lakhs. So, that’s a difference of 1 cr lost in this quarter.
If we add that back, then EPS for this quarter would have been 0.6 rs.
Another good thing is company has started paying dividend. Rs 0.3/- per share. 0.82% dividend yield is not bad.
At 0.55 EPS in Q4, assuming minimum 15% EPS growth in the next 3 quarters, then forward EPS for an year will be 2.75 at the end of 2018.
Aksh is trading at 13x multiple in forward EPS. 15% EPS growth is conservative, considering the Silvassa and Mauritius OFC capacities coming online in June 2018. That’s additional 1.7mn FKM.
And additional 0.4mn FKM FRP capacity coming online in September 2018. And Ophthalmic lens production just started. So, we can expect more EPS growth in the upcoming quarters.
If we exclude Services segment, then EPS is standing at a whopping 0.7 rs for Q4. And trading at 9.5x multiple at forward EPS (assuming 20% growth).
If we compare this with peer Sterlite Technologies, then Aksh is dirt cheap.
From the presentation:
“We also expect to see the incremental benefits of our capacity expansion initiatives in the financial year 2019 and beyond, going forward this will also pave the way for sustainable growth for the company.”
All looking good w.r.t revenue growth and profit growth.
Negative points:
- Finance cost increased - From 4.31cr to 6.01cr.
- Receivables went up from 184cr (Q3) to 245.6cr (Q4)
When a huge part of the turnover is supplied to Govt departments/ BSNL…then the receivables are bound to go up. First the goods are supplied and payment is received with a time lag. I won’t consider it as a big negative
Receivables continuously increasing trend which is a real concern, can any one post receivable cycle in comparison to Sterlite tech?
One need to clarify it with management. Is there any concol gonna happen?
Any details on show cause issued by SEBI on GDR issue case by company? Effect on share price and company growth, any analysis done by anyone pls share.
GDR is an old issue and company can handle it well so its not a major issue as far as I understand…
On previous discussion on receivables increase, I have noticed that when there are client like govt companies such as bsnl or other big corporate, receivable increase with revenue is normal phenomenon…but should be tracked on quarterly basis
Other than that everything looks rosy as of now as dubai facility revenue and opthalmic lens revenue will contribution from q1
My assessment of Aksh is that in FY19 it can do an eps of 3-3.5 rupees and if Dubai facility starts making profits, then the eps can jump to 5 rupees…as of now Opthalmic blanks and services are not contributing to the eps…
I have never understood the optimism on this counter. Technicals have to be supported by fundamentals. This is the 6 yr PAT numbers for Aksh
25.78 21.67 25.33 25.60 9.66 20.84
They have posted 20% lesser PAT this year than what they did in FY13. Why should this company have anything over a 10 P/E (i.e about 220-250 Cr Mcap) for such abysmal numbers?
If you see the balance sheet, it has grown like this
547.93 580.87 649.17 673.46 741.55 940.69
Balance sheet has nearly doubled even as profit has de-grown. How? Money that came in via debt and dilutions (about 300 Cr) is locked in CWIP and Receivables (about 400 Cr). I haven’t delved deeper into the ARs here so I don’t know what this CWIP is that it has stayed a WIP for over 5 years and still remains so!
I think company has raised debt and equity and has siphoned this money off and these balance sheet items of receivables (245 Cr) and CWIP (165 Cr) will get written off sometime in the future and the company would have pocketed a neat 200-300 Cr in 5 years while people following charts look at Cups, Handles and Triangles wondering why the price isn’t moving their way. At best I was expecting a pump-and-dump to materialise here and have been watching with curiosity.
Aksh Optifibre is a high beta trading stock. In its whole life, it has never been a compounding story. Best strategy here is buy a couple of thousand during the period of negativity and fear and dump it again after couple of months when people start talking about the great optic fibre theme.
Mehnaz seems to believe that promoters need to show this or that amount of profit which inherently implies that management is cooking the books. So the real question is why should one trust their hard earned money with this kind of management.
Disc. Invested around 1% of the portfolio at around Rs 13 levels. Sold half at 35-36 levels. May sell the rest if it reaches that level again. On the contrary, may accumulate more if it crashes and reach 15-20 level.
Its the volatility, and investor euphoria and fear about this stock that keeps me interested in this stock.
This is not a Buy/Sell/Hold recommendation.
Let me compare Aksh with a company that you are optimistic about - Sterlite Technologies.

Look at EPS and the Balance Sheet of Sterlite from FY2008 to FY2015. While EPS went down gradually from 15.45 to 0 (2 years of loss), Balance sheet went up from 1590cr to 8672cr. That’s 5.5X.
How did the Balance Sheet grow 5.5 times when the profit degrew?
CWIP in FY2015 was 2365cr (out of 8672cr BS).
For Sterlite, FY2008 EPS was 15.45. FY2018 EPS is 8.34. 50% lesser PAT. Why should this company have anything over a 10 P/E (i.e about 2700cr Mcap) for such abysmal numbers?
In FY2008, Mcap was 10 times lesser. Now why is the Mcap 10x when the numbers are pathetic?
This is the last 5 yr PAT trajectory for Sterlite Tech.
-35.51 -2.64 153.71 201.38 334.33
Sterlite Tech 3 Yr profit growth was 235% (as of FY17 when I entered) and they completed Capex in FY16 and you can see CWIP numbers reflecting that
263.36 712.93 2,181.20 3,548.76 2,192.64 172.32
See the debt trajectory during the same period
767.78 1,036.51 2,820.75 4,338.24 5,316.29 1,085.16
and the profit growth since then justifying capex and the market valuations as well rewarding the same. The point being, WIP has to be completed and numbers have got to reflect and justify not just be locked in CWIP and receivables!
However, Sterlite Tech has been overvalued from the time it crossed 220 levels. I have exited Sterlite Tech last month since a lot more capacity is going to be coming online in a couple of years and the same sort of growth may not be possible so yes, I am not optimistic about Sterlite Tech and I have booked out completely for now.
Sterlite has demerged the power cables business and optical fibres business…hence the present is not comparable with the past
Same is the case with Aksh. Sterlite started showing PAT growth after the capex was complete. Now Aksh has almost completed its current capex. And the last 2 quarters showed topline and bottomline growth. If Aksh manages the same kind of growth that Sterlite had from FY2016, why won’t Aksh get better valuation?
We’ll see it in the next 2 or 3 quarters.
To substantiate what I was saying, here is a comparison of some crucial capex related numbers for Aksh and Sterlite Tech from FY09 to FY17 - only because they are both in the same industry.
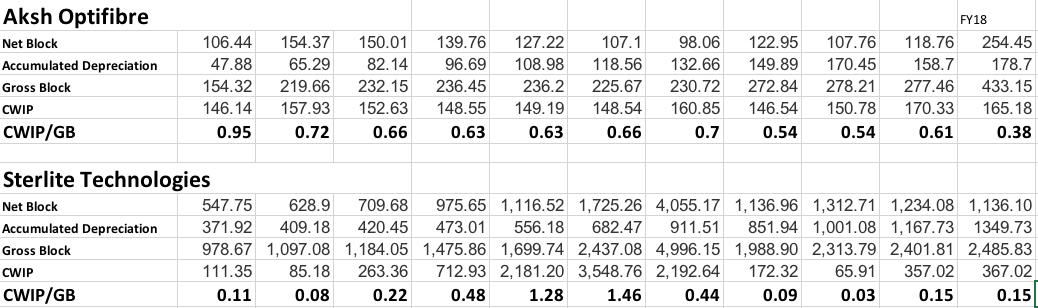
The interesting numbers for me are CWIP/Gross Block
This is one of the ideas I found in Ambit Capital’s fraud detection filters.
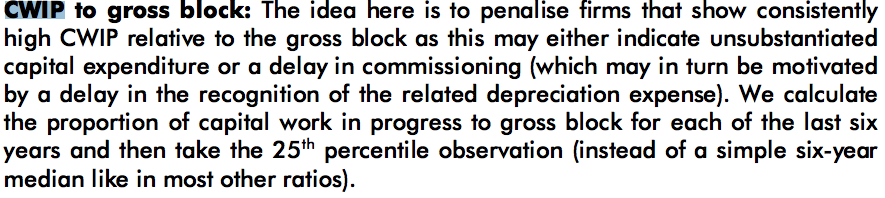
There shouldn’t be such a big variance in CWIP/GB for the two players in the same industry. It looks like CWIP remains more or less constant for Aksh at around 150 Cr. and every now and then they claim capex completion and the increase in Net block is compensated by the depreciation. This way they can keep a large capital in the balance sheet locked as CWIP.
I am however curious about what has happened in FY18 with the increase in Net Block - and a somewhat better CWIP/GB (i.e if they don’t announce more capex plans in FY19 - meaning this is a clear case of pilferage). If P/L supports, it would still be hard to be convinced of the legitimacy going by the past but a pump-and-dump scenario can still play out - where the FCCB and GDR conversions in FY16 can get an exit.
clarification…there are no pending GDR and FCCB …all have been converted in 2015
Good point. Not much info available on this in the ARs. Will check with the IR.
What do you mean by this? In FY2018, Net block increased, also the accumulated depreciation increased, thereby increasing the gross block, so CWIP to gross block will obviously be lesser. Or do you mean that when net block increases, the depreciation expense will increase in P/L?
What is the relation between a better CWIP/GB in FY18 and not announcing capex in FY19. I don’t get it. Better CWIP/GB in FY18 was due to increase in NB and GB.
Which past? Past of Aksh (or) any other company with similar traits in the past? Can you elaborate?
hi @phreakv6 would u mind sending the link of Ambit Capital fraud detection filters, should be very helpful to all of us.
I am putting myself in the shoes of a promoter who is taking in debt and has to show it in the BS while siphoning it off. A company can continue having money locked in CWIP if it keeps completing capex equal to the amount of depreciation and then deploy some more money in CWIP to make up for it. It can continue this until the asset gets impaired at which point it can deploy more money in CWIP - This is all assuming that there is some pilferage involved. The Net Block hasn’t meaningfully increased much between FY10 and FY17 for the amount that has been locked in CWIP during the period.
Coming to FY18 - This is where Net block has meaningfully increased - However, if more assets were impaired in FY18 (we will only know when the AR comes out and watch for changes to the Gross Block), then the Accumulated Depreciation will be lesser (AD of assets replaced are removed) than the figure I have used in which case the Gross Block may not have moved as much as the figure I have used for FY18 and consequently CWIP/GB would be higher than what I have. This is one possibility.
The other is that, the company announces more Capex in FY19 which will increase CWIP (the numerator) and so even more capital will be locked in the balance sheet and CWIP/GB will remain high. This is also a possibility and to confirm, I looked at how the debt has changed to see how the liability side of things has changed in the recent balance sheet. Debt has increased from 115 Cr in FY17 to 238 Cr in FY18. Isn’t this a big red flag? Why does a company which has completed capex that is yet to payoff take in more debt?
My guess? This 120 Cr of new debt will get locked in CWIP as the company announces some fancy capex for the year and the cycle will go on. What I meant as “going by the past” is the very high CWIP/GB ratio which is a big red flag. If you see the Ambit report (Not posting here due to forum rules), they have used Balkrishna Inds as an example and that really cannot hold a candle to what’s in Aksh’s BS.