Very true, someone is beating the best-of-league hallow on ‘certain’ parameters. Time and again - since real long time. This has troubled me a lot for quite some time. Therefore, as a first step, have tried to understand the ‘HOW’.
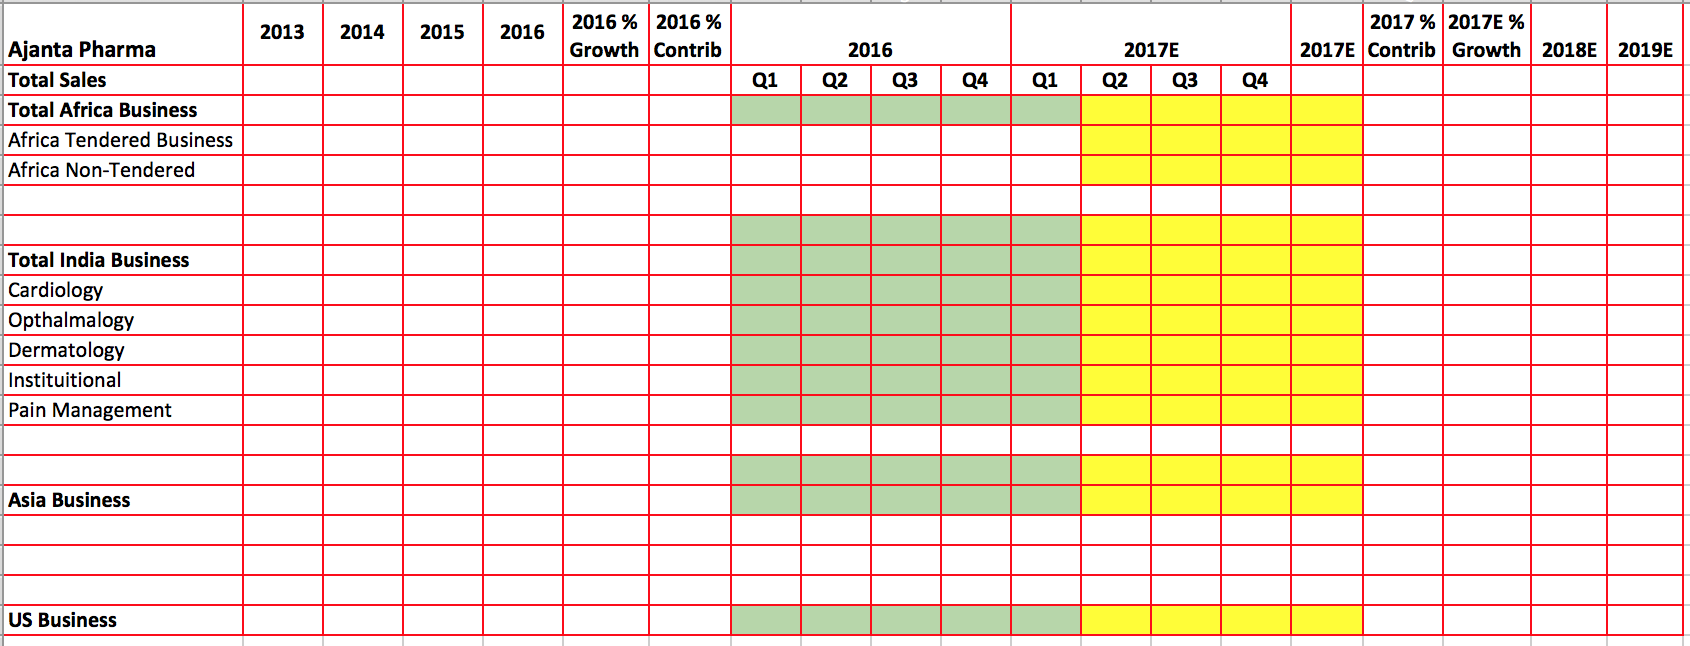
To begin with, let’s paint a mental picture of how much AP is different from peers and on which all parameters. Hope this attached spreadsheet will help create an industry level vivid view.
MS Consolidation Sheet_Pharma(2).xlsx (36.2 KB)
With this comparative view, I tend to think Ajanta performance is in top of league in some of the metrics but not really astronomically high/low. What really stands out is the ability to tick most of the boxes of efficiency.
Now the mental questions:
- How come someone can have such best-in-class assets/fixed assets turn over?
- How come someone can have such decent inventory turnover?
- Exemplary below EE cost% and raw material % etc?
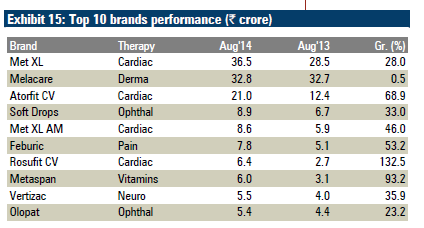
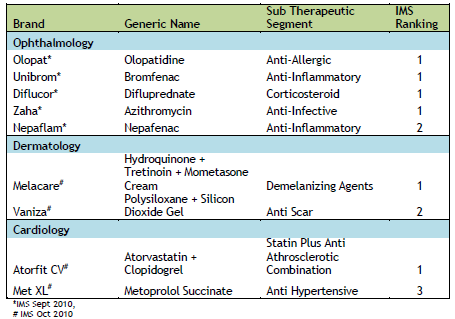
Initially zoomed-in greatly from a process door (geographical spread, segments, fist to file contribution, block busters like Melacare, Kamagra etc.), only to end up getting even more perplexed. Later on, tried to zoom-out entirely and just think bit arithmetically.
At the cost of sounding overly simplified approach, lets do a simple mathematical/financial calc.
Cost of manufactured good is Rs 40.
Company C: Sell the same for Rs.100 (mark-up/gross profit is 60 Rs.)
Company B: Sell the same for Rs.120 (mark-up/gross profit is 80 Rs.)
Company A: Sell the same for Rs.140 (mark-up/gross profit is 100 Rs.)
Now, try calculating the key metrics for these three companies.
- Rest all things being same; which company looks good for any ‘higher-the-better-metric’ where total sales goes as numerator? ((i.e inventory turnover, assets turnover etc.)
- Rest all things being same, which company looks good for ‘lower- the- better metric’etc. where total sales goes as denominator? (% of EE cost, % of row material cost, other cost %)
Do I hear company A?
So, what I tend to think is that this company A is reflecting superior efficiency metric by virtue of significant marked-up sales.
No No, it cant be this simple.
Fine, I apply some counter thinking. This company A should look comparatively inferior for a ‘lower- the- better-metric’ where total sales goes on numerator. Check the DSO on the above attached sheet for Ajanta. For sure, nowhere close to the best.
Hummn…fine that’s partial explanation, AP is great in so many other aspects as well.
Ok, lets look at the SG&A expenses (delta between Gross to operating margin%), on the attached spreadsheet, 13 out of 22 other companies has narrow delta (representing more efficient SG&A expenditure) than what AP has.
Talk about tax efficiency, (delta between operating to net margin %), 17 out of 22 other companies has narrow delta (representing better tax efficiency than what AP has).
Connecting the dots, what I see here is the evidence of handsomely marked-up gross sales playing a key role in making some of the ratios look envious. For validation, look at the gross margin % column (col W of attached sheet). Gross margins only behind Sun and way above rest all -year after year after year.
Well, this revelation is nothing new. We always ‘knew’ that AP got a high margin play. What is significant is that at least I have started recognizing how fat profit margins can make you look great at so many other places.