
To add to it. In 2008 highs, our Market Cap to GDP ratio was 1.7 or 1.8 IIRC. Today the Market Cap is roughly same for a GDP that’s double in size and Market Cap to GDP is around 0.7 - 0.8 (if I heard Ramdev correctly in this presentation).
1 Like
Yes, sensex is 6-7% lower in dollar terms today than in peak 2007-08. Although I tend to focus mainly on the 2008-09 bottom n mostly ignore the top.
1 Like
Hi Vaibhav,
Would be great if you can elaborate in simple language your 4th point. I am not able to grasp your logic properly. Thanks much.
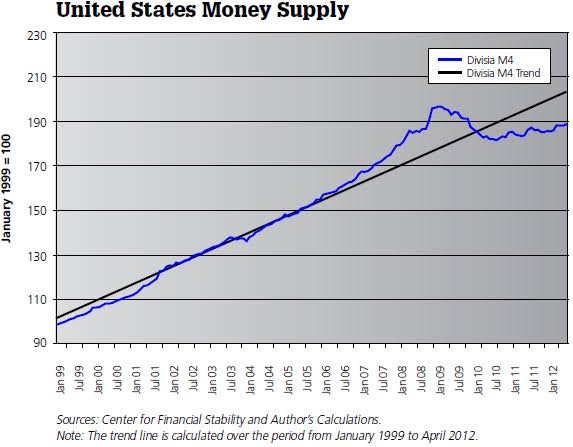
" M3 can be thought of as a congregation of all the other classifications of money (M0, M1 and M2) plus all of the less liquid components of the money supply. M0 refers to the currency in circulation, such as coins and cash. M1 includes M0, demand deposits such as checking accounts, traveler’s checks and currency that is out of circulation but readily available. M2 includes all of M1 (and all of M0) plus savings deposits and certificates of deposit, which are less liquid than checking accounts. M3 includes all of M2 (and all of M1 and M0) but adds the least liquid components of the money supply that are not in circulation, such as repurchase agreements that do not mature for days or weeks."
^ Definition on the internet. My thinking is that Stock market’s base today, should also shift upwards from 2008-09 crash’s base in similar ratio to how M1, M2 M3 monies have grown from back then, or how the nominal GDP (in rupee terms) has grown…
1 Like
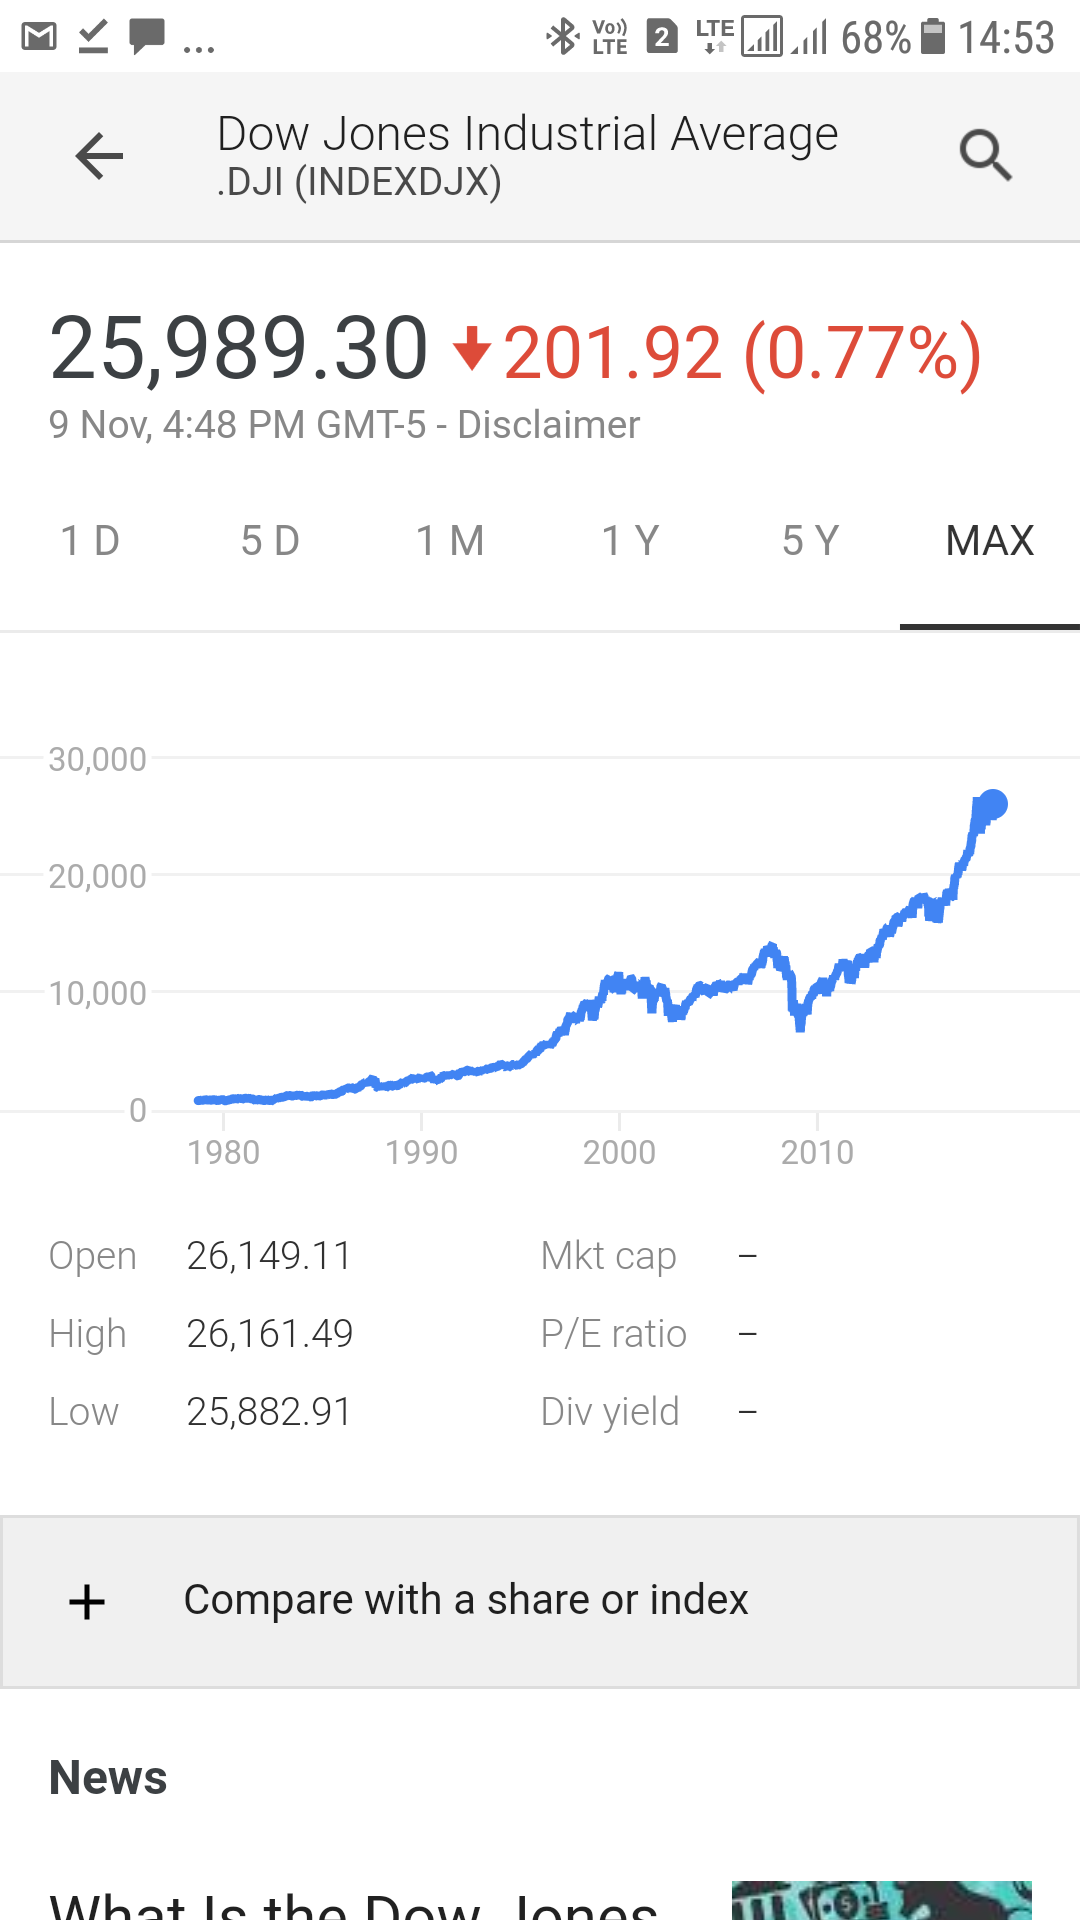
It’s an interesting concept to correlate stock market base with money supply, but unfortunately it does not hold true in historical backtesting. As you can see from below charts, US 2009 money supply was almost twice that of 2002, but still 2009 breached the 2002 low. Same thing about GDP can be found out by compaing Chinese GDP growth and stock market returns in last one decade.
1 Like
In the current bear market, small and mid caps have been in the bear territory for a long time while large caps barely touched correction mark. In fact, there was a time when small caps entered bear zone on the same day large caps hit all time highs.
Normally one would expect these two indices to move together. Smaller stocks are expected to be more volatile than larger ones but one would still expect them to move in the same direction. However, that’s not so true in Indian markets. If you simply divide BSE Small Cap Index by BSE Sensex, you will see how small caps have performed relative to large caps. If these indices move together, you would expect the ratio to stay within a narrow range and not show any ‘runs’ i.e. a series of up move for several months followed by a series of down moves for several months as that would indicate one asset class outperforming other one for a long period of time.
Chart below shows ratio of BSE Small Cap Index and BSE Sensex from 2003 onwards.
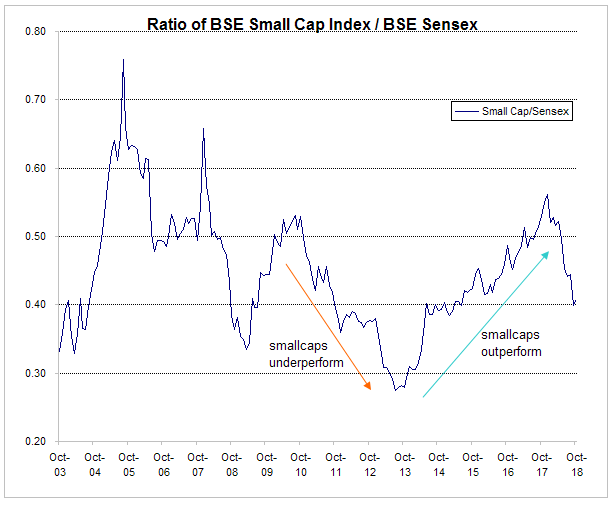
Source: BSE
As the chart above shows, small caps outperform large caps for few months/years and underperform for next few months. Over the last few months, we have seen small caps underperform sensex by a large margin. Current ratio is 0.4 which is below the long term average of 0.45. While the absolute value of the ratio is meaningless, how the ratio have moved over the years is important. As the ratio indicates, small caps are now cheap relative to large caps. They can get cheaper (as happened in 2013) or stay cheap longer (small cap’s down run can last 2-3 years, and we are just 1 year into it) but at least small caps are not expensive on a relative basis. ‘relative’ being the key word here.
37 Likes
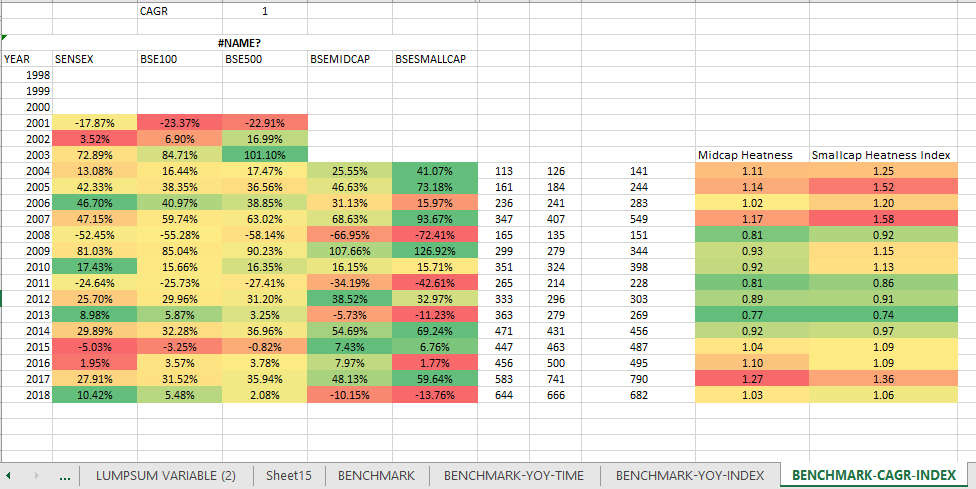
Really interesting to see the above chart Yogesh. How are you calculating the ratio? I also do something similar t least on an annual basis to understand the heatness of caps as they do not move in sync. This is what I had done based on Jan to Jan data
1 year CAGR basis
3 Year CAGR basis
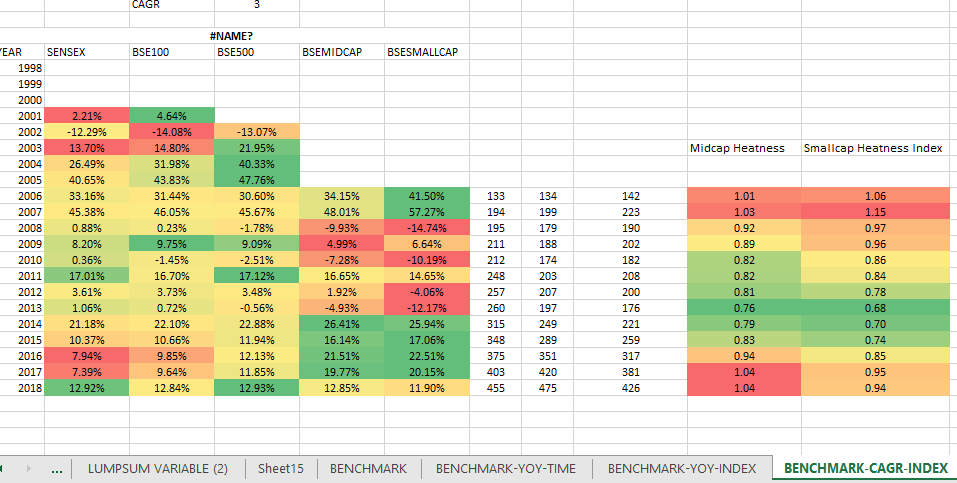
So, 2013 was the time when 3rd year in a row smll n mid cap under-performed sensex and reached the highest attractive level in last 15 years of history and then they started outperforming and reached their peak in 2017 and have started cooling off in 2018 though not yet at 2013 levels.
The other data point I have been looking but not able to get it EPS data for small cap index and mid cap index since 2003 to further add to analysis. I think this might help us to decipher better between price wise and time wise correction based on over/under performance. Off late, what I have seen in Q2, small cap companies have performed much better than large cap, so, a price wise correction and EPS based performance would help to cover the attractiveness gap much quicker with respect to only 1 factor out of 2 contributing. Do you have it by any chance?
1 Like
Hi Yogesh,
Let me share an update from a tool, that you only designed. This might add value to your point of small cap under valuation esp relative to mid or large cap.No of stocks out of 100 nos above 200 DMA for large/mid/small are 29%/25%/9%
It seems Small cap 100 is clearly undervalued…
Sharing a link from VP
1 Like
Nifty smallcap index is down arnd 35% from the top (9600) whereas bse small cap index is down arnd 27.5% from top 20150. Quite a significant gap between the two smallcap indices.
@vicky_7900, From https://www.amfiindia.com,
AUM @ 2009 is 4.5L cr,
AUM @ 2013 is 7L cr,
AUM @2018 is 22.4 cr.
M1, m2, m3 monies of 3.5x have already reflected here. Ramdev also mentioned, currently PE of indices are high compared to average. This happened due to assigning excessive PE multiples without earnings reflected. So, yes, money is there to push the prices up but valuations will not be supported without earnings. Too much money is of no use without earnings growth. Till now what happened is valuation growth in anticipation of earning growth and due to excess liquidity. Any structural turnaround in India Inc. earnings like in 2002-03 have not started yet.
3 Likes
Interesting data this. There is no denying the fact the market is still overvalued. But a strange thought came to my mind. Most of the mutual fund investors dont know anything about the valuation. They buy regardless of the valuation. ( Unfortunately the fund houses dont stop fresh inflow when its overvalued) . Also, there is no other interesting alternate investment opportunity. So dont you guys think the overvaluation will remain? (Of course there are other participants like FII etc. But this too is a dominant force) . If they were to sell, where would they invest the proceeds in?
Ramdev said he only just realised that high growth rates are unsustainable for 15-20 years …I thought that that’s quite ordinary and he should have known it all along…for ex. At 42% cagr your money becomes 2^10 in 20 years = abt a 1000 times. So, 5000 cr. Marketcap Becomes 50 lac crore…and at 26% cagr , 5000 cr. Becomes 2^7 = 128 times in 21 yrs i.e.6.5 lac cr. How many Indian companies have m.cap. between 6.5-50 lac crores? So, the wisdom that has dawned upon him now should have been known all along imho since he is regarded as an expert.
And today too, perhaps people like Ramdev are overlooking the possibility that due to sluggish growth,low inflation n low interest rates in future, PE ratio are going to remain elevated for ever…18-20 frwd PE (and 21 TTM PE now) for nifty may be fair (or undervalued) looking from the future.
4 Likes
I too believe over valuation would remain. If we have to go by historic data https://nifty-pe-ratio.com/, Nifty is overvalued since 2014. It has not corrected since. The lowest PE we registered in last 4.5 years is 19.38, that too with poor earnings cycle. Compare this to 2002-2006 PE ranged between 12-17 during block buster earnings cycle. So, these excessive PE of 21-25 could be new normal considering domestic inflows and state of other asset classes. But my point of discussion is on earnings. Without earnings, valuations would not grow beyond a point. It only leads to volatility.
If you observe FII/DII data, FII inflows are cyclical and stagnant since 2007. We are just above the same level of inflows as during 2007. Where as DII investments are structural in nature and they gradually moved up matching FII investments. As @vicky_7900 pointed, Nifty has hardly registered any growth in dollar terms since 2008. It barely managed to double since 10+ years, where as inflation eating out those returns too. No wonder FII flows are stagnant. If there is a consistent real earnings uptick (significant inflation beating returns without currency risk), you may see FII inflows resuming like in 2002-2008 period. The rupee appreciates as it is linked to inflows. Hence earnings is the most important factor market is waiting for to justify the valuations.
1 Like
Crude is down to $67 levels. It never should have gone above $80 as there is enough and more supply of crude in the world. Trump has had his ego busted by the mid-term results which could mean that a resolution to the trade war is nearer than it was last week. There could be a fundamental shift of power in the world from producers of crude to consumers of crude going forward, no matter what the near-term geopolitics is. It will all eventually boil down to supply and demand. This is the best chance for us to put the house back in order. The only hurdles I see are the liquidity issue and RBIvGovt. which should see an outcome by end of month or even within a week and domestic politics - which should be taken into account for equity allocations (Allocations should ideally vary as inputs change continuously, like a bayesian updater).
8 Likes
The biggest factor in valuations in near to medium term is liquidity. The last few years have been very kind in terms of a barrage of liquidity induced by extremely low global interest rates. With a lot of money chasing few good quality companies in a shallow market like India we saw a surge in valuations.
Globally also because of very low rates of interest rates money found its way to a lot of toxic assets and going forward if rates continue to go up there can be big unwinding in these assets and associated collateral damage.
This high PE low growth scenario may (or may not) revert because I think one has to be very mindful of mean reversion as a concept. One cannot take this high PE environment for granted as it would amount to complacency.
Even after the strong correction witnessed in last few months, its difficult to find absolute no brainers or screaming buys. Maybe we have been acclimatised to paying more than normal valuations for reasonably good companies (not necessarily top notch high quality companies). It would be really interesting to see how investors behave if things get reasonably or extremely cheap. Fear often is the overwhelming emotion in such situations.
28 Likes
Systemic problem in Indian financial system was NPA’s sitting on Banks other financial institutions Balance sheet. There is still stressing the financial system…Jet is another one to fail. If there are many more than we still have problems. If not be are on stable platform for now. There is no immediate trigger. The trade war is start of the battle. There can be a little compromise and even if there is a compromise it is not going to satisfy any one as there is mistrust growing in the world and it is a multi polar world with every one trying to lead the world in what they think is the best for their country. It will be alignment and reorganization of partnership creating a new world order. Keep watching
This is too funny! I love how we humans manage to come out with most farfetched and deluded predictions!
Ill tell you what will happen to a nestle at a high pe
bear case: stock de rates to 40x as earnings catch up basically a time correction with some downside in the mid term. It will be a quick derating to 50ish and then gradually fall as earnings catch up, so stock price will hover between a small range and the hit will be around 10-25% and the stock will trade within that band. Post 2 years we should see the stock begin to move on the back of some earnings growth. Post year 4 the company will look alright at 25-30x.
Base case: The stock will sustain at 50x until earnings catch up. So a textbook time correction for 2 years or so post which we will movement on the back of earnings growth.
So still a long term investor has atleast 12%cagr over the next decade…
What is PE first of all? as earnings grow and price stays the same the PE will fall. What matters is sales growth and roce. One has to account for roce in valuations. Would you rather own a business growing at 25% with roce of 15% in a secular industry or a business growing at 15% with a roce of 25% in a secular industry, let us assume roce of 15% trades at 10x and roce of 25% trades at 20x. Most investors will buy roce 15% company (inspite of knowing that that growth is not sustainable as the company will most likely have to raise capital). If a company can grow sales at 10% plus each year coupled with a high roce then effectively it is able to consistently deploy cash at high rates of return. Simple. What do current valuations have to do with this looking 5 years out? nothing. Worst case you make 12% cagr over 5 years. Best case you make 15-20% cagr and if you hold out beyond 5 years you are looking at serious upside!
Terminal value of businesses are underestimated. This whole era of tech and disruption has clouded everyones thought process, they think everything is going be changed. Inspite of home automation paints are still used, inspite of fitbits traditional watches are still worn… more in fact. And soon im sure the incumbent watch guys will simply license tech and make their watches smart. Would you buy an apple watch or a rolex smart watch (assuming both are the same price hypothetically), inspite of magnet technology that has been around for a long time adhesives are still rampant, Inspite of wifi ethernet cables are still used, inspite of the smartphone/kindle book sales are still growing, inspite of this whole solar/wind thing… coal is still growing and will supply base load for decades to come mark my words on this! I love the whole creating a new world order statement!
Bottom line is this, dont bother about market fluctuations just buy slowly and average high quality cos. Thats it. These mega corporations have the ability to aquire tech. Look at VW launching an EV at 23k, tesla all of a sudden has mega competition now. Tesla may turn into just another car company right? While certain investors think the company will take over the world…
Just relax and stay rational. 10 years from today I can say with some confidence you all will be drinking alcohol from diageo on new years eve, dancing in a club/house painted with asian paints, puking into a cera pot, smoking an itc cigarette, wearing jockey undergarments, eating maggie noodles at 5am with a cup of coffee from bru/nescafe likely processed by our very own ccl products.
19 Likes
This. I have had people come and tell me that they won’t invest in Banks because Fintech companies are going to destroy them. I told them Banking is more than just technology and involves ALM, Credit appraisal process, distribution etc. The best banks already leverage technology efficiently and it is easier for banks/nbfcs to use technology (like Bajaj Finance) than for technology companies to do traditional banking
1 Like
If a company has a float they can do alot. I would like to explain this with a few illustrations.
Using the float/exisitng business to fund new ventures.
-
Nestle using cash from child care food products and maggie. This is a continous engine to innovate. Now launching healthier variants of maggie etc etc
-
ITC with cigarette business. Now can afford to own some of the finest Real estate assets too!
-
Reliance inds with oil funding jio.
This why capital allocation is very important. If roce is high that shows mgmts ability to deploy capital at high rates of return. This in turn mostly means that the float is being deployed well.
Any disruptor can be aquired with ease by these cos. Look at britannia launching a fund to fund start ups in food. Imagine what a startup can do with britannias resources in the consumer space.
Look at cos with the capability of generating such floats in the future like a nesco. Like a page through jockey could end up creating a big float. Floats can be created via the cash flows of the company not the reported pat. One has to see how much incremental cash flow the company is generating that is why fmcg and consumer type businesses get such valuations. Of course todays are expensive but you get the point
Look for cos who have steady float type businesses with decent roces but are investing in newer verticals and ventures and hence roces are depressed on the face of it. The engine must be generating stable cash flows at high roces and the incremental cash must be moving into newer products and ventures. People often wonder how to make alot of money, its when you find these sorts of businesses because they are overlooked due to poor metrics. And once investments start to pay off we see operating leverage take over and margins expand. Hence roces go up etc etc:
7 Likes
No one is denying the fact Long term is bright for outstanding companies. It is the short term every one is anxious for… Idea of putting thoughts is to clear the doubts you have with short term to play for long term Horizon.