
I am not able to access the drive folder. It says the folder is in the owner’s trash.
Hi Pradip,
Nice work of connecting data from Screener and charts to visualize the data.
You can consider using separate charts for each data series in expenses and assets so that changes in individual items can be easily spotted.
You can also add some charts related to cashflows.
Overall, nice work and keep sharing.
4 Likes
Here is another version; thanks to Yogesh for his idea of the overview sheet and Saurabh for his work comparing companies.
Some charts require manual update of data - as screener.in does not provide it - have marked those charts as ‘Manual’. Look for the ‘Source Data’ on the graph to see which rows/columns need to be updated.
T - SafeCopy.xlsx (609.8 KB)
7 Likes
Thanks for sharing PavanM. It is fairly detailed reflecting the amount of hard work you have put it in!
I think the underlying story behind the data if weaved in a simple and intuitive way works really well. I mean, since there are only two conclusions to arrive (to invest or not invest) from the data, any novice investor should find it fairly easy to connect all the dots and understand the story.
I am working on enhancing my Analyzer further as suggested by @Yogesh_s. I am also going to ‘steal’ some ideas from your Analyzer as well 
1 Like
@pradip I need your advice regarding IRB I’m invested in. I was reviewing it based on the price action on Dilip buildcon. I am concerned about it’s debt level. Valuation and the industry outlook is good. Their model is that they sell their assets to their sister company for realization. If we are entering a higher interest environment their ROE can be hit which is already very low. Now your Excel sheet shows Altman score to be in the dangerous level. Your reading of the situation will be much appreciated. Thanks
Saji,
Happy to help. The reason Altman is showing that the company has a high probability to go bankrupt is because the Mkt Cap ( INR 7,836 Cr.) is a miniscule ~17% of the total FY17 assets (Rs. 46,684). The mkt. cap should be higher than total assets.
I am attaching the analyzer for IRB and PSP projects. Please do a 1-1 comparison on all metrics (Revenue, Earnings, Cash Flow, Debt etc). You would notice a lot more red flags in IRB file.
P.S. I have enhanced further the analyzer. Will soon share a User Guide on how to use it. The time this new analyzer takes is 10 min compared to 5 min earlier ![]() PSP_Projects_VU.xlsx (269.0 KB)
PSP_Projects_VU.xlsx (269.0 KB)
IRB_Infra.xlsx (276.1 KB)
5 Likes
I received a few requests to share the latest excel tool from some boarders. Attached is the latest one. Below guide will help navigate through it -
What needs doing to fill the data -
There are two grey colored tabs towards extreme right -
* Screener input -Download excel from screener. Copy-paste “Data Sheet” tab to this tab
* Shareholding input - Visit NSE website to get shareholding distribution data for last 6 Yrs.
That’s all! This will take 10-15 min time.
What you get from the tracker -
Valuation - Two red colored tabs towards the extreme left estimates the valuation of the company using Sanjay Bakshi’s concept and a conservative approach.
Balance Sheet, Cash Flow and P&L -The green colored tabs in the middle provide a view on revenue, profit, RoE, Cash Flow, Assets, Liabilities, Shareholding pattern and lot more.
The purpose the tracker serves is to help understand the business in numbers and also estimate reasonable valuation. Will be happy to guide if you would need any further help using the tracker ![]()
Britannia_VU.xlsx (281.3 KB)
22 Likes
With a few min left for Yr 2018 to become history, the pain the market brought with dismal returns will also become history…
But are so called “smart investors” really smart? Did they manage to buck the trend and took home money?
Lets check it out…
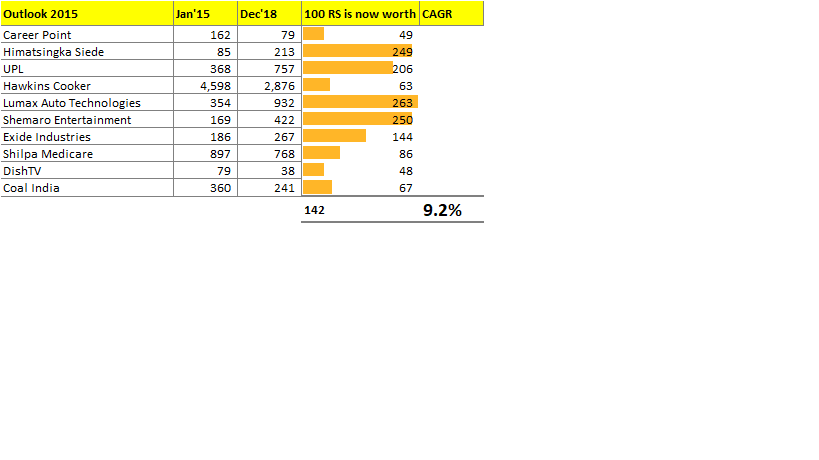
Outlook Business starts every new year with a stock recommendation list. Recommendations from smart investors. The stories are pretty compelling and you would feel like buying the stocks the moment market opens.
Since Jan’15, #56 stocks have managed to feature in the list. Now the billion $ question - How much money did these stock made?
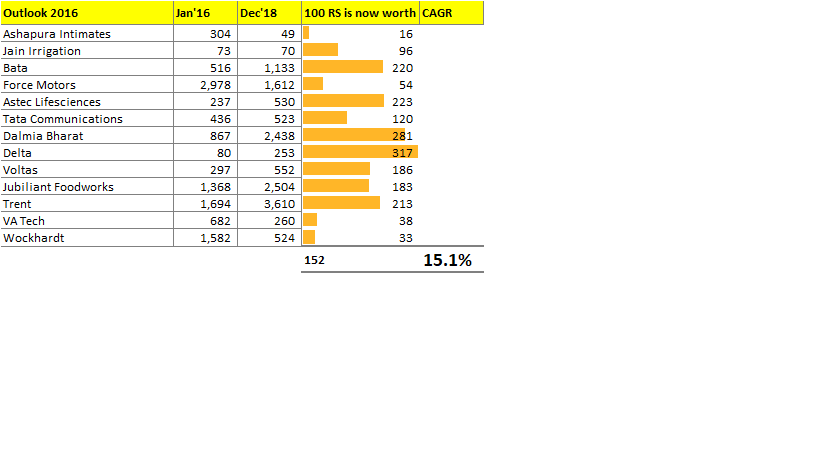
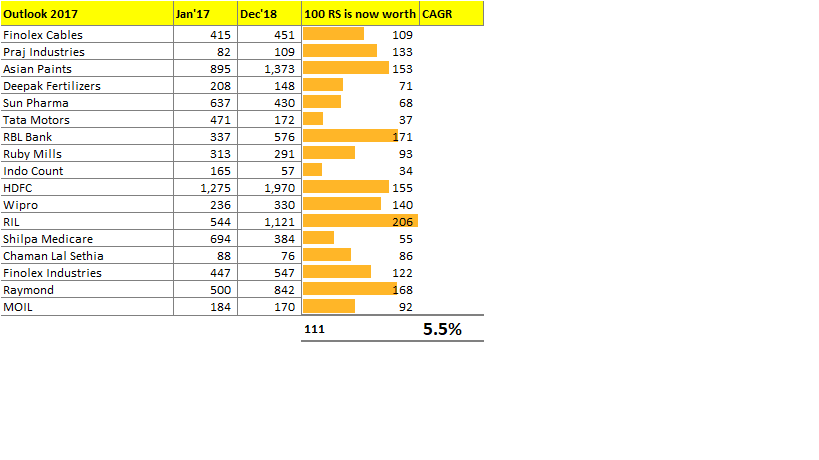
CAGR for Jan’15, Jan’16, Jan’17 & Jan’18 recommendations are 9.2%, 15.1%, 5.5% & -13.0% respectively. This maths has made simple assumption that equal amount of money was spent on each stock.
Not encouraging. Isn’t it?
Are these smart investors really “smart”? If they really have an edge over retail investors like us, why aren’t the returns reflecting that?

1 Like
In my opinion, recommendations are for that year only. So i would calculate the returns till December of the corresponding year only. Smart money is smart because it knows when to bet and when to fold.
1 Like
Check 2018 , you get your answer.
Dec 18 -Shilpa Medicare price differs in 2015 & 2017 tables …any reasons -split/bonus etc?
I was trying to go through your spreadsheet, on sheet called “screener output” you have a figure of 186.42 in cell c22 which references current cash ?
Why is current last cash balance shown as r&d of 2009 ?
Excellent work Pradeep!
1 Like
Looking at it a bit as I had time, there is a template being sold at this location by dr vijay malik
https://premium.drvijaymalik.com/product/stock-analysis-excel-template-screener-in/
I am not selling or promoting this but am interested in replicating some of the ratios
Hi Pradip, this is an excellent tool you built there! Truly appreciate for your efforts.
I just have one small query though - what do the terms ‘Distance covered’ and ‘Distance left’ stand for? I’m not sure if I clearly understand and am curious to know.
Thanks so much!
Thanks Pradeep (@pradip) for sharing the spreadsheet with all. I am sure this will benefit us.
Spent sometime to understand underlying approach and additional features. Just happened to notice that hidden sheet ‘MICAP’ has some formula error on cell B15 to B18. Possibly due to deletion of referenced sheet.
Please see if you want to fix this formula issue.
Thanks again for sharing this with larger community.
Tarun
1 Like
@edwardlobo Thanks for pointing out. That was an error. Have corrected it. Nonetheless, the number isn’t getting used in any of the formulas.
@vardhmanchhajed
Distance covered - How expensive/(cheap) the stock price is compared to historical PE/PB
Distance left - CAGR at which the stock price can appreciate in coming years. I have used two approaches here - One suggested by Prof Bakshi and other is a simple “what-if” scenario build on varying levels of NP margin and Sales growth.
@T11
The MICAP sheet isn’t getting used anywhere. I have now deleted it.
Attached is the latest version of the template with couple of new charts. The modus-operandi to update the template is same as earlier.
What needs doing to fill the data -
There are two grey colored tabs towards extreme right -
** Screener input -Download excel from screener. Copy-paste “Data Sheet” tab to this tab*
_** Shareholding input - Visit NSE website to get shareholding distribution data for last 6 Yrs.*
_CCL_VU.xlsm (248.6 KB)
5 Likes
Hi Pradip,
where can I get shareholding data on NSE website ? can you please share some link for example ?
You can check for the shareholder data on BSE if the company is also listed on BSE.